
Versatile Group

Category: Uncategorised

  • AFS Sieve Grades- What is that?!

    AFS Sieve Grades- What is that?!

    From the vast amount of choices that the user has to make to choose the right Sieve for application, I shall try to give you a rough chart of sieve selection. The most important of them is the Grade.
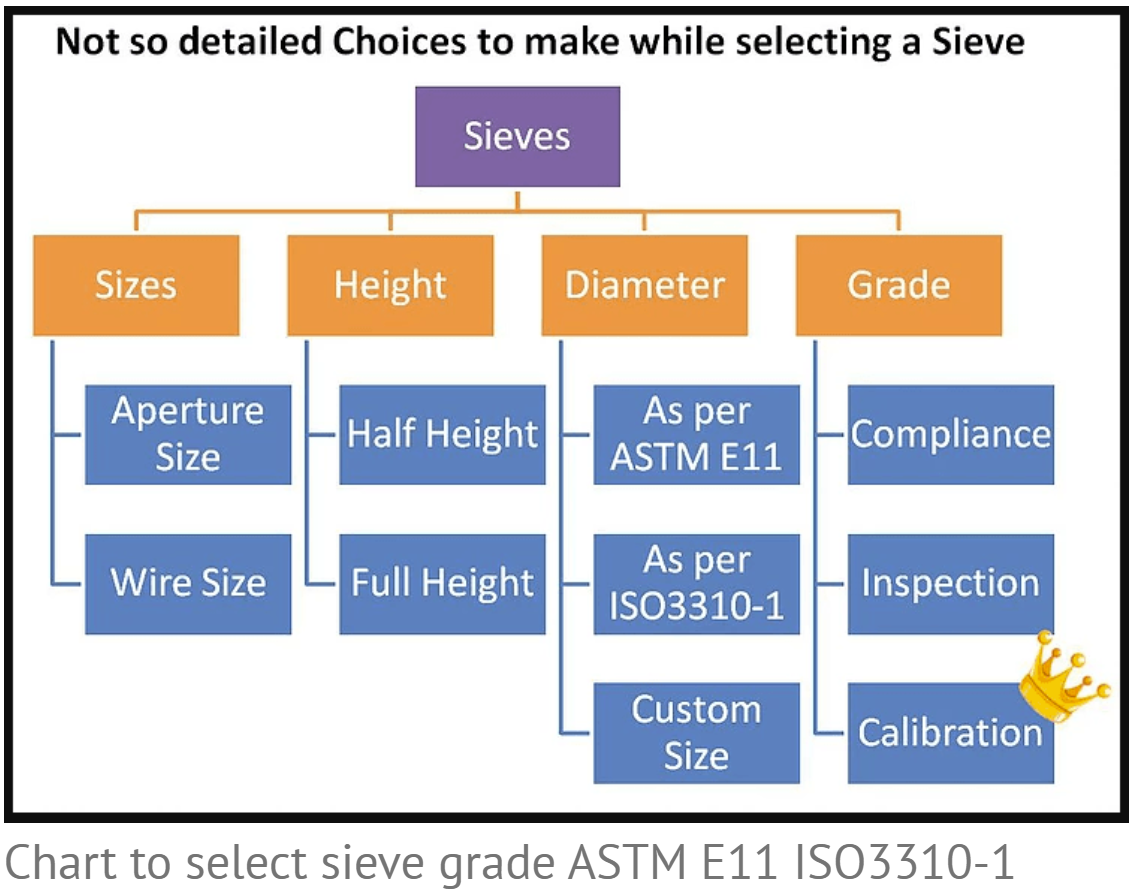
    While the ISO standard for analytical wire mesh sieve (ISO3310-1) was revised quite a while ago, the ASTM E11 followed the suite and also introduced three types of certifications for Sieves which divide them in grades. As we can see from the chart

    1. Compliance grade Sieve

    2. Inspection grade Sieve

    3. Calibration grade sieve

    Dont’ worry, its not quite complicated as it sounds!

    ESSENTIALLY ALL THESE SIEVES ARE MADE WITH THE SAME FABRIC OF WIRE-MESH WITH THE SAME MANUFACTURING PROCESS.

    As you may have observed or will observe in future that, a Calibration grade Sieve will cost you a bomb as against a compliance sieve.

    Here’s essentially why

    1. Issuing a Compliance certificate is mandatory for a manufacturer who claims conformance to ASTM E11 or ISO3310-1 standard. Well, the certificate doesn’t or may not give any statistical data which is generated during inspection of the Sieve and just state that, the Sieve Complies with blah..blah..blah standard.
    2. The Manufacturer on request of Customer should provide a Inspection grade certificate which mentions the statistical data such as average aperture size, separately in both the warp and weft direction of the wire cloth. Well, the manufacturer may charge you for this.
    3. For both Compliance and Inspection grade sieve certification, the same number of apertures are checked, essentially the reason why their prices shouldn’t be poles apart and Thou shall have predicted value of confidence level of standard deviation at 99% for the process of compliance and inspection
    4. Many manufacturers underrate compliance sieve just because the users don’t read standards of compliance but, as per standard both compliance and Inspection grade Sieves should be equally accurate and precise.
    5. On the other hand sits the Calibration grade sieve, which gets checked for more than double the number of holes than their less fortunate counterparts and Thou shall have predicted value of confidence level of standard deviation at 99.73% for the process of calibration and here comes the important part, the manufacturer must give you results that shall be stated for the number of apertures and wire diameters measured (For a 53 Micron Sieve, that, number is a whopping >500 measurements of the tiny holes!)
    6. What does that mean to you?

      1. Well, if you are doing super critical work (Rocket Science, Nuclear Science, Critical Medicine) day in and day out heavily relying on Sieving results the 0.73% increase in confidence level is a substantial difference and you should use calibration grade Sieve set.
      2. On the other hand if your testing is not a matter of life and death (e.g: Grading Minerals or Cosmetics or Foods for that matter) but the testing is frequent, then you should have one Calibration grade sieve set in wraps to frequent check if your compliance or inspection grade sieve set is in order.
      3. if you’re testing is not a matter of life and death (e.g: Grading Minerals or Cosmetics or Foods for that matter) and the testing is infrequent, then you should use compliance or inspection grade Sieve set.
      4. Compliance sieve set can only be bought, after using it for a while, when you send it back to manufacturer it shall come back as Inspection grade (Don’t forget to ask for the little statistics we owe you.)
  • Are you Under-mixing or Over-mixing your Green Sand?  Enter, the Wet Tensile Strength!

    Are you Under-mixing or Over-mixing your Green Sand? Enter, the Wet Tensile Strength!

    The Problem: Under-Mixing vs. Over-Mixing

    The goal of the mixing cycle is not just to distribute ingredients, but to activate the bentonite. This requires energy and time to shear the clay platelets and force water between them to create the binding gel.

    • Under-mixing: Results in “latent clay.” You are paying for bentonite that isn’t working because it hasn’t been fully plasticized. This leads to friable edges and erosion defects.
    • Over-mixing: Wastes electrical energy, slows down the molding line, and increases sand temperature (due to friction), which accelerates evaporation and requires higher moisture additions.

    Why Wet Tensile Strength (WTS)?

    While Green Compression Strength (GCS) and Compactability are standard control parameters, Wet Tensile Strength is uniquely sensitive to the quality of the clay activation.

    WTS measures the strength of the sand in the “condensation zone”—the weak, super-saturated layer that forms behind the mold face during pouring. High WTS correlates directly with the bentonite’s ability to resist scabbing and expansion defects. Crucially for mixing, WTS rises sharply as the clay activates and creates the necessary “bridges” between silica grains.

    The Optimization Protocol

    To find the optimal mixing time, you must perform a Saturation Curve Study.

    1. Preparation

    Ensure your return sand is consistent. Do not run this test during a start-up or a product change. You want the only variable to be the time inside the muller/ mixer.

    2. The Sampling Procedure

    Run a standard batch. Instead of dumping the batch at the normal time, extend the cycle and take samples at fixed intervals directly from the muller/ mixer (carefully) or by stopping the muller/ mixer.

    • Sample 1: 45 Seconds
    • Sample 2:  60 Seconds
    • Sample 3: 90 Seconds
    • Sample 4: 120 Seconds
    • Sample 5: 150 Seconds
    • Sample 6: 180 Seconds

    Note: Adjust intervals based on your current cycle time. If your current cycle is 120s, you need data points before and after.

    3. Laboratory Testing

    For every sample collected, immediately test for:

    1. Moisture & Compactability: (To ensure the sand state is comparable).
    2. Wet Tensile Strength (WTS): The primary metric.
    3. Green Compression Strength (GCS): As a secondary reference.

    Interpreting the Data: Finding the “Plateau”

    Plot the Mixing Time (X-axis) against the Wet Tensile Strength (Y-axis).

    You will typically observe one of three curves:

    1. The Steep Climb (Under-mixed): If the WTS is still rising significantly at your current set time (e.g., 90s), you are dumping the batch before the clay is fully activated. You are wasting bentonite.

      • Action: Increase mixing time OR improve muller/ mixer efficiency (plough adjustment).
    2. The Plateau (Optimal): The curve rises and then flattens out. The point where the curve flattens is your Maximum Potential.

      • Optimization Strategy: Identify the time where you reach 90-95% of the maximum plateau value. Mixing beyond this point yields diminishing returns—you are spending energy for negligible strength gains.
    3. The Drop-off (Over-mixed): If the curve rises and then begins to fall, the friction heat is drying out the sand faster than the bond is improving.

      • Action: Reduce mixing time immediately.

    Practical Application: The ROI

    By identifying the exact minute/second where the WTS plateaus, you can reprogram your PLC timers.

    • Scenario A: You find you reach 95% activation at 80 seconds, but you run for 100 seconds. Reducing the cycle by 20 seconds increases your plant’s potential throughput by 20% and reduces energy consumption per ton.
    • Scenario B: You find you are under-mixing. Extending the cycle by 15 seconds allows you to reduce your bentonite addition by 0.5% while maintaining the same strength properties.

    Conclusion

    Optimizing mixing time is not a “set and forget” activity. As muller/ mixer ploughs wear down or sand-to-metal ratios change, the activation efficiency changes. Using Wet Tensile Strength as the benchmark ensures that the sand plant is driven by data, not by habit.