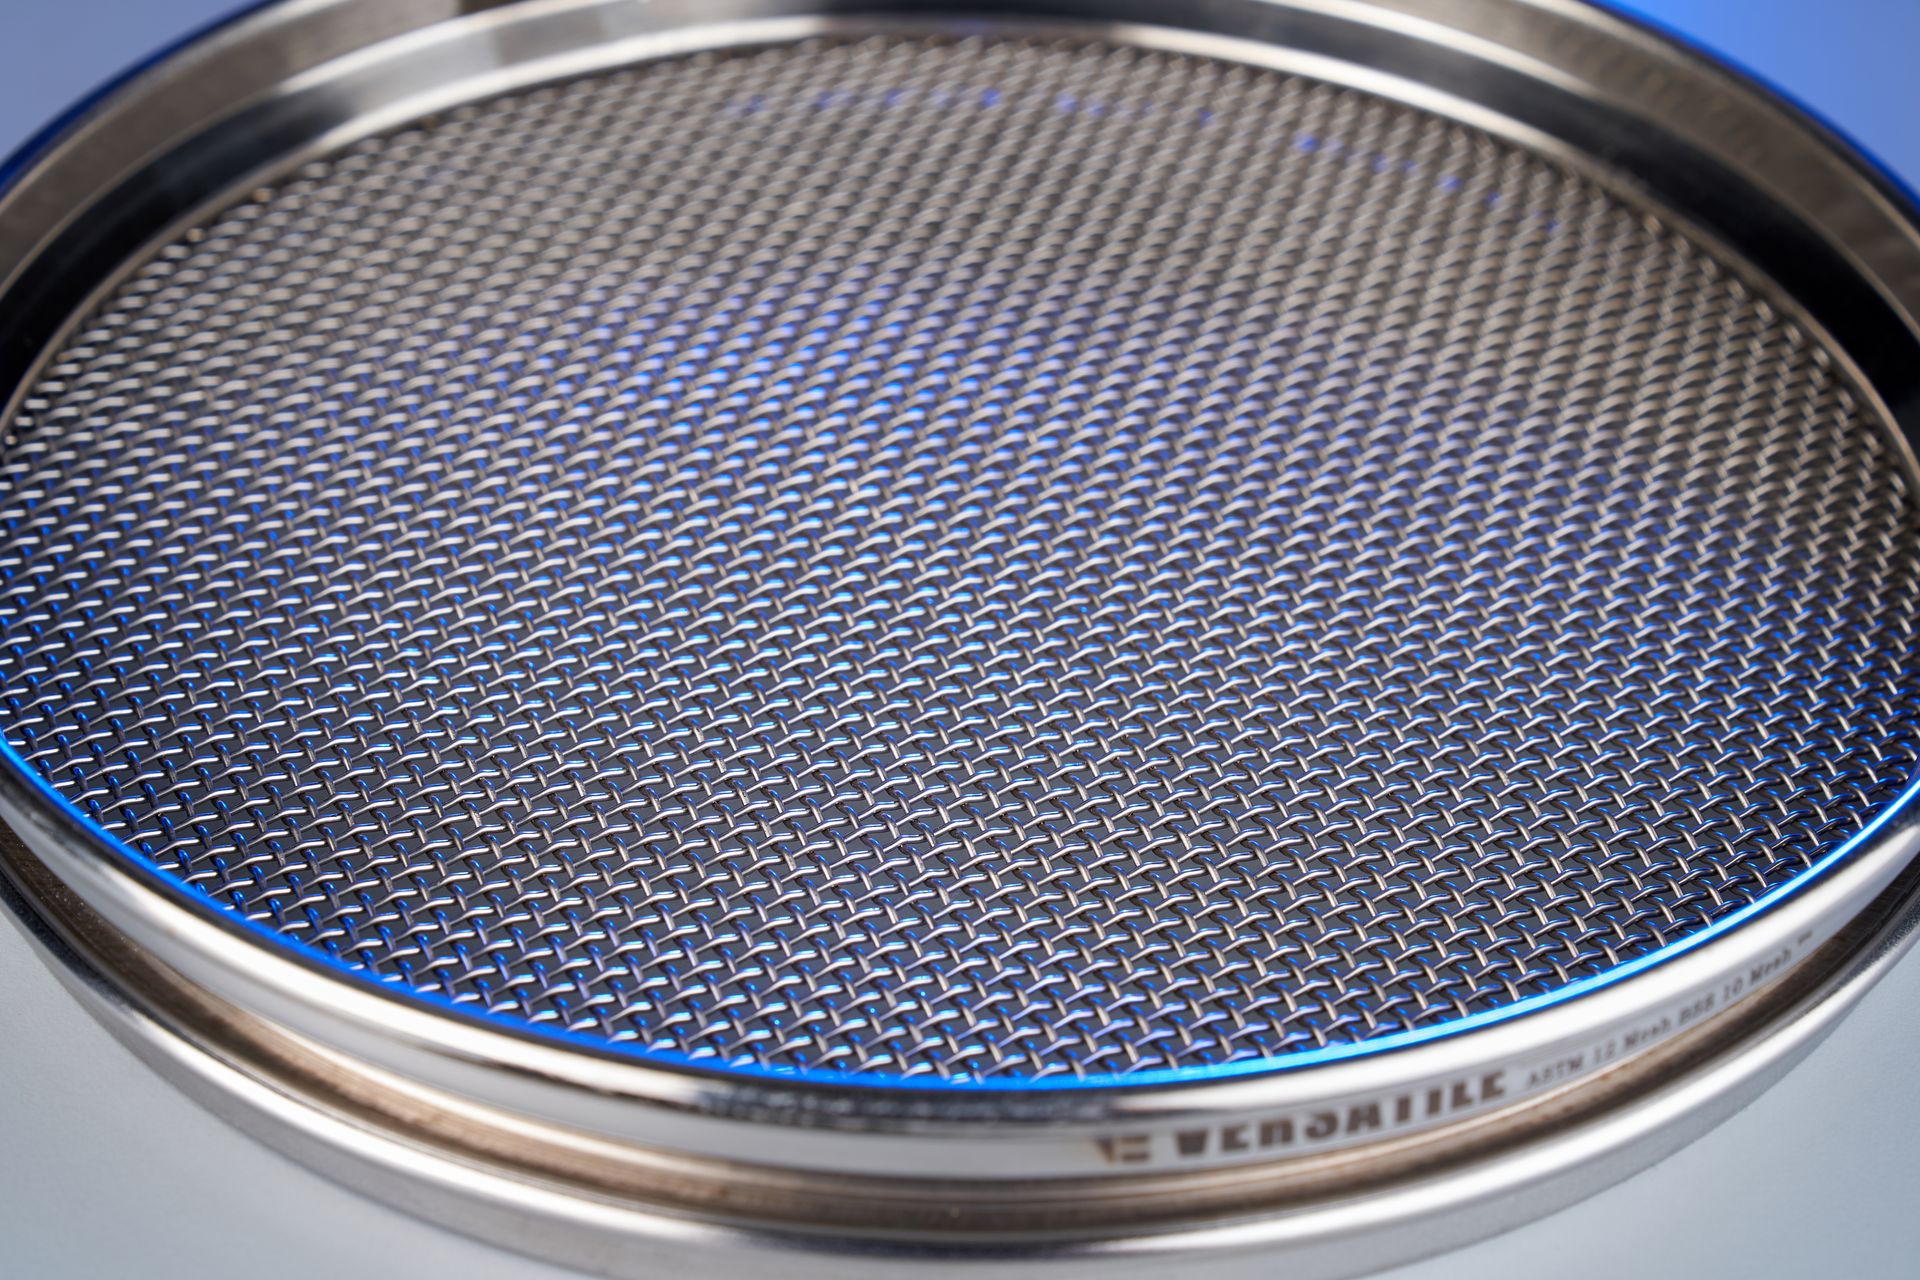
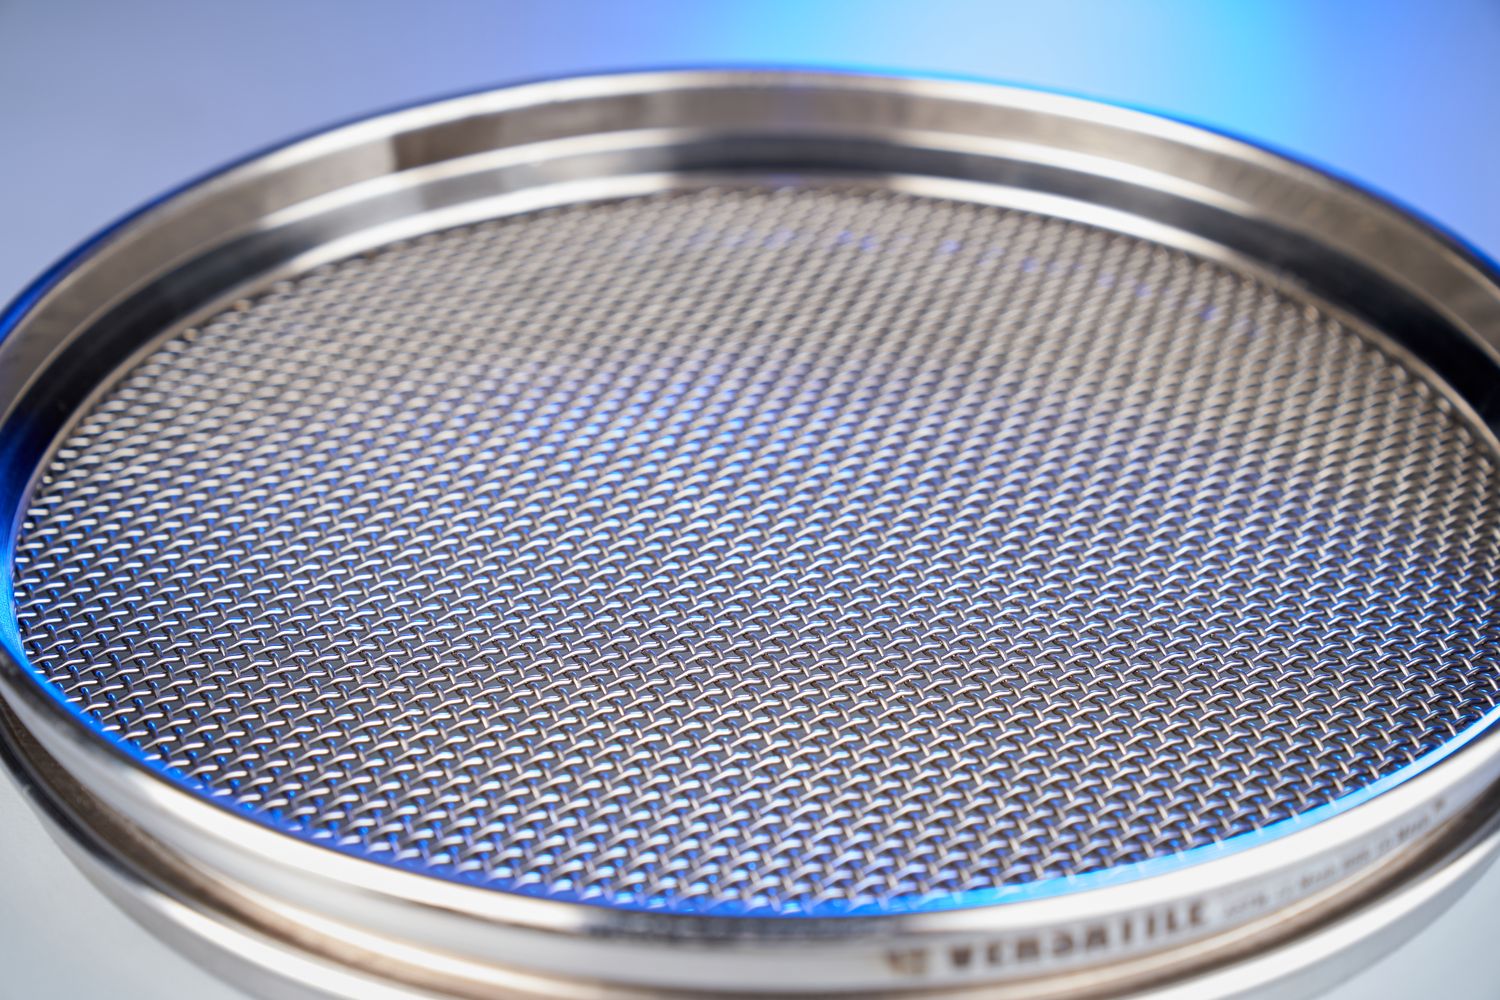
One-piece stainless steel test sieves, woven to ISO 3310-1 and ASTM E11, individually serial-numbered, and certified in our own NPL-traceable laboratory. Built in India, trusted across foundries, laboratories and process lines in more than 40 countries.
Measured to the micron
A sieve is a measuring instrument, and we hold it to that standard. Each Versatile test sieve begins as a monolithic stainless frame and a sheet of precision woven wire, with no solder, no filler and no shortcut. Aperture and wire diameter sit inside the tolerances the standard allows, and the cloth is drawn taut and flat so material meets the aperture it is meant to.
Aperture in microns, ASTM and BSS mesh, and a unique serial number are laser-engraved into every frame. Nothing to peel, fade or swap between samples. Every sieve is a record of itself.
The range
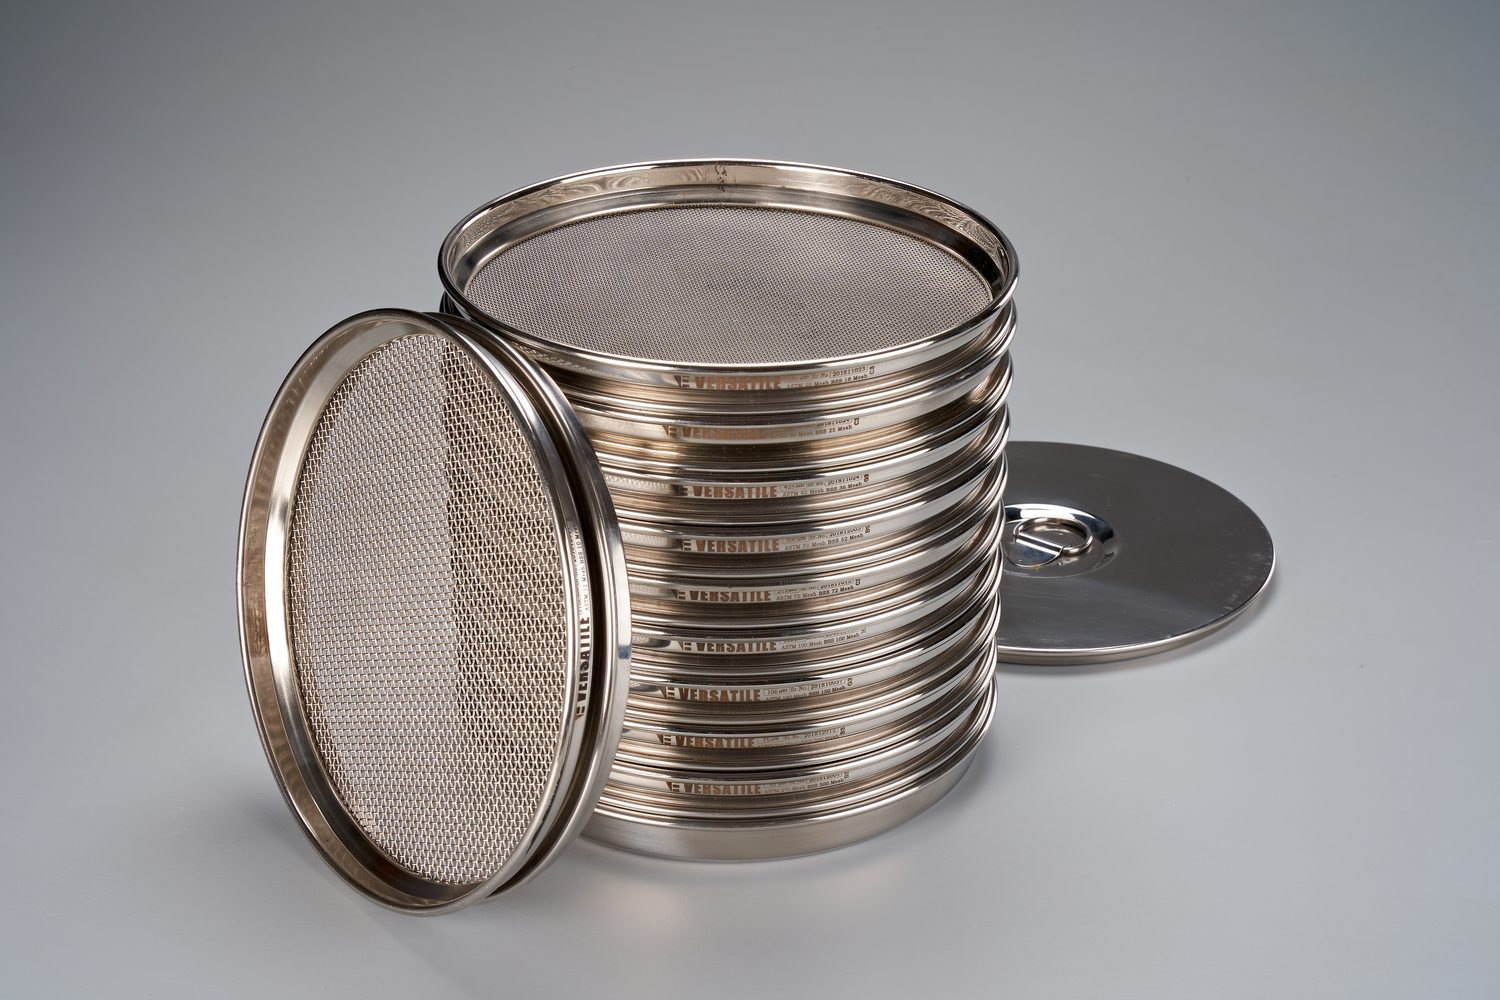
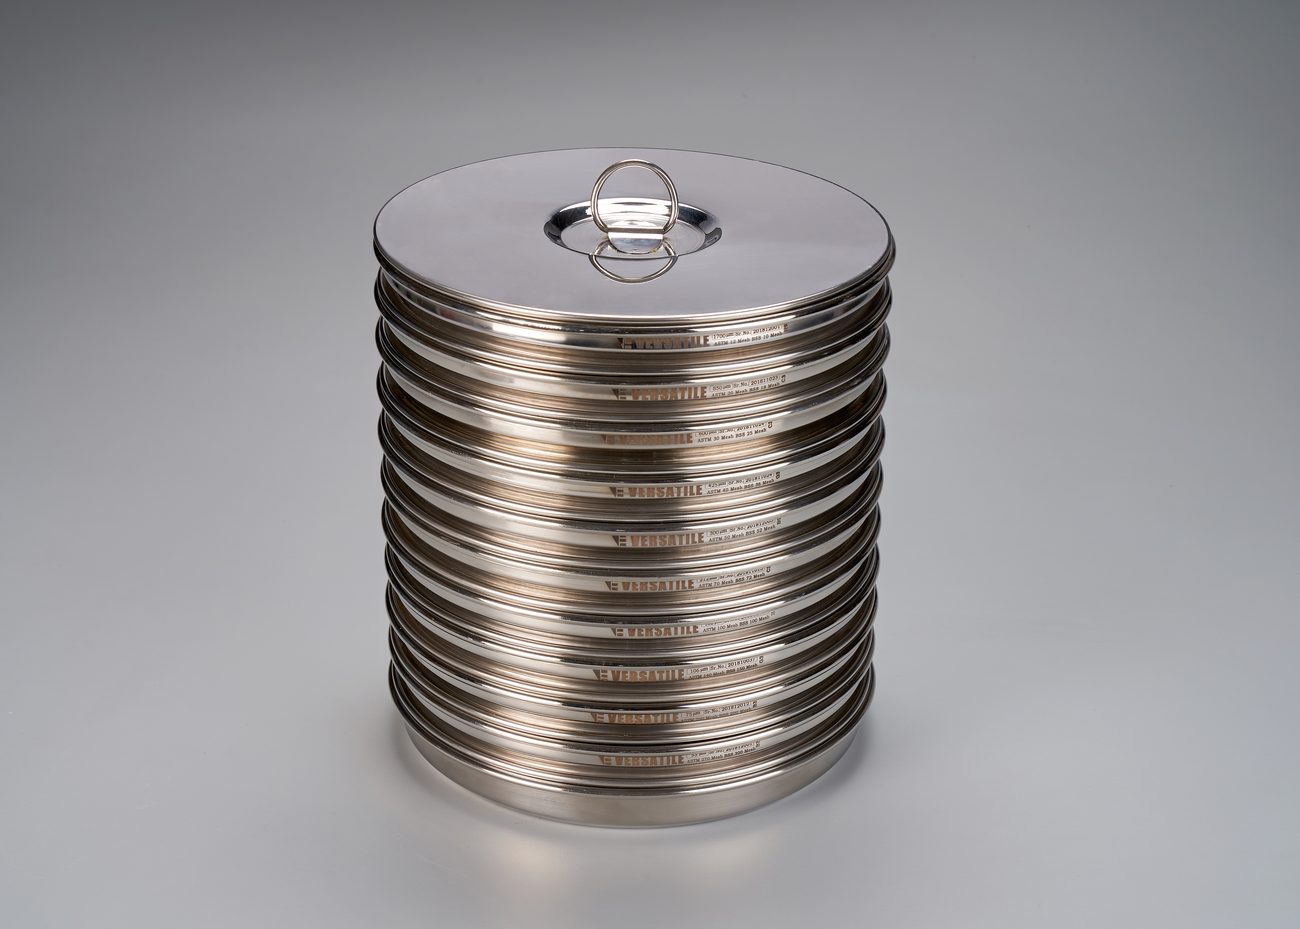
Eight-inch (203 mm) frames in full height and half height, across the ISO 3310-1 aperture range. The foundry AFS series runs as a matched set from 1700 microns to 53 microns.
Complete AFS sieve set, full height — view the set
Complete AFS sieve set, half height — view the set
A measuring instrument is only as good as its calibration. We inspect and certify in our own laboratory, against reference standards traceable to CSIR-NPL, the national metrology institute of India. Three grades are offered, and all three measure against the same references — what rises across them is the number of apertures verified and the detail reported.
Compliance — openings verified by a statistical sample against ISO 3310-1 and ASTM E11 tolerances, with a compliance certificate. For routine QC.
Inspection — a larger sample of openings measured and reported, with the mean aperture stated. For audited laboratories.
Calibration — the most openings measured and individually reported, for reference master sieves and referee testing.
We certify the sieves we build, and we re-certify yours. To request inspection or certification, write to our team.
For every industry that measures particle size
The test sieve began, for us, in the foundry, where grain fineness decides whether moulding sand is fit to pour. It did not stay there. Any process that lives or dies by grading meets the same instrument, held to the same standard: pharmaceuticals, minerals and mining, food and beverage, cement and construction, ceramics, chemicals and powders, and metal powders for additive manufacturing.
Complete the bench
Pair a certified nest with a mechanical shaker for a separation that holds up to an audit, and read grain fineness at a glance.
Tell us the material and the standard you report to, and we will specify the apertures, frames and certification grade, and quote for delivery worldwide. Request a quote.
In the high-stakes environment of the modern foundry, precision is not just a metric: it is the barrier between profitability and scrap. While standard sand laboratory tests like grain fineness, tensile strength, and Loss on Ignition (LOI) provide essential baseline data, they suffer from a critical limitation: they are static, room-temperature measurements. They tell you what the sand is, but they fail to predict what the sand does when it encounters the violent, high-temperature reality of molten metal.
This gap in predictive capability is where casting defects: veining, hot tears, dimensional inaccuracies, and penetration; often hide. To bridge this gap, foundries must look beyond the “cold” properties of their molds and cores and examine their dynamic behavior under thermal load. This is the domain of the Hot Distortion Test.
The Versatile Hot Distortion Tester (VHD) is not merely a testing instrument; it is a time machine that models the future behavior of your cores and molds during the critical seconds of pouring and solidification. By measuring the millimetric deflection of a bonded sand specimen as it undergoes thermal shock, the VHD generates a “Hot Distortion Curve” (HDC); a graphical DNA fingerprint of your sand system’s thermal performance.
The Physics of Failure: Why Standard Tests Miss the Mark
When molten metal enters a mold, the sand interface experiences a sudden, extreme temperature gradient. The binder system must navigate a complex series of physical and chemical transformations in seconds: it must expand, relax, cure, and eventually collapse.
A standard tensile test pulls a specimen apart at room temperature. It cannot tell you if the binder will soften too quickly (causing dimensional loss) or remain too rigid (causing hot tears). The Hot Distortion Test replicates the casting environment by heating a standardized specimen on one side, mimicking the metal-to-mold interface. The resulting distortion is measured continuously, creating a narrative of the sand’s life cycle.
Decoding the Hot Distortion Curve (HDC)
The power of the Hot Distortion Test lies in the curve. A typical HDC for chemically bonded sand is divided into four distinct regions, each revealing specific insights into casting quality.
Region 1: Upward Deflection (Expansion)
The Mechanism: As the test begins, the heat source strikes the bottom of the specimen. The silica grains on the heated face expand rapidly. Since sand is a poor thermal conductor, the top of the specimen remains cool and unexpanded. This differential expansion forces the specimen to bow upward, registering as a positive deflection.
Foundry Implication: This region is dominated by the base sand’s characteristics (type, shape, density).
High Upward Deflection: Indicates excessive expansion, which can lead to mold wall movement and dimensional inaccuracies.
The Goal: Reducing this peak is crucial for high-precision castings.
Region 2: Thermoplastic Relaxation (Plasticity)
The Mechanism: As heat penetrates the binder matrix, the curve drops into negative deflection. This is “Thermoplastic Relaxation.” For shell sands, this phase occurs as the phenolic resin melts and the Hexa (hexamethylenetetramine) begins to decompose into ammonia and formaldehyde. The binder viscosity drops, and the sand “sags.”
Foundry Implication: This is the most misunderstood phase.
The “Goldilocks” Zone: You might think cured sand shouldn’t be plastic, but some plasticity is vital. It allows the core to absorb the expansion stress of the silica. Without this “give,” the rigid core would crack under thermal shock, leading to veining or hot cracking.
Too Much Plasticity: If the curve dips too deep, the core is too soft. It may distort under ferrostatic pressure, causing the final casting to be out of tolerance.
Region 3: Thermosetting (Secondary Cure)
The Mechanism: The chemistry shifts again. The formaldehyde released in Region 2 is now consumed by the resin, triggering a transition from thermoplastic to thermosetting. The binder crosslinks extensively, becoming rigid. The slope of the curve flattens as the structure stabilizes.
Foundry Implication: This phase confirms the binder’s ability to re-establish rigidity after the initial shock, ensuring the mold holds its shape during metal solidification.
Region 4: Degradation and Failure
The Mechanism: Eventually, the heat overwhelms the organic binder. The resin bonds burn out (Loss on Ignition), and the specimen loses structural integrity. The curve plummets until mechanical failure occurs.
Foundry Implication: The time elapsed from the start of the test to this failure point is the Hot Strength.
Premature Failure: Indicates low hot strength, leading to core breakage or erosion during pouring.
Extended Survival: Indicates high hot strength. While good for durability, if the core stays rigid for too long, it won’t collapse during shakeout. This leads to difficult cleaning and can cause stress fractures in the cooling metal.
The Digital Revolution: From Research to Quality Control
For decades, the Hot Distortion Test was viewed as a “research-only” tool. The curves were complex, and interpreting them required a PhD-level understanding of polymer chemistry. There was no easy way to say, “This curve is good, and that one is bad” without laborious manual calculations.
Versatile Group has changed this paradigm.
The VHD integrates advanced software that democratizes this data, turning complex curves into actionable Quality Control (QC) signals.
1. Defining “Normal” with Statistics
The VHD software allows foundries to test a baseline of “good” production sand. It then automatically calculates the average curve and the standard deviation for every second of the test.
Instead of guessing, you define a Statistical Tolerance Band (typically ±3 Sigma).
This band accounts for natural “Common Cause” variations (minor changes in humidity, mixing, etc.).
2. Real-Time Production Monitoring
Once the tolerance band is set, the VHD becomes a shop-floor tool. As an operator runs a test, the live curve is plotted against the stored tolerance band on a color monitor.
In-Spec: The curve stays within the shaded region.
Out-of-Spec: If the curve intersects the tolerance limit, it visually alerts the operator immediately. This signals a “Special Cause” variation: bad resin, wrong sand mix, or machine error: that requires immediate attention.
3. SPC Charting (X-bar and R Charts)
The system exports deflection data to spreadsheets for deep statistical process control. You can plot specific data points (e.g., “Deflection at 17 seconds”) on an X-bar/R chart to track trends over weeks or months. This reveals slow drifts in process capability that single tests might miss.
Case Study: The Invisible Difference
A shell sand foundry was evaluating a new base sand formulation. Standard tests (Sieve analysis, Tensile, LOI) showed the new sand was identical to the old sand. Based on conventional data, they were interchangeable.
The Hot Distortion Test revealed the truth.
When tested on the VHD, the two sands produced significantly different curves:
Region 2 Discrepancy: The new sand showed different plasticity characteristics.
Region 4 Discrepancy: The new sand failed faster (shorter time to failure).
The Result: The foundry predicted that the new sand would reduce shakeout time (better collapsibility) but might be more prone to thermal cracking due to the plasticity shift. Production trials confirmed exactly this. The VHD predicted performance differences that no other test could see.
Why Choose the Versatile Hot Distortion Tester?
The VHD is engineered for the modern foundry that demands both rugged reliability and scientific precision.
Precision Sensing: High-accuracy displacement sensors record deflection to 0.01 mm.
Automated Consistency: The single-touch, fully automated burning mechanism removes operator variability, ensuring that every test is repeatable.
Comprehensive Data: Store, overlay, and compare unlimited curves. Validate new binder shipments before they enter your silos. Optimize resin content to save money without sacrificing hot strength.
Take Control of Your Thermal Performance
Don’t let the heat of the pour be a mystery. With the Versatile Hot Distortion Tester, you can predict defects, optimize shakeout, and guarantee casting quality before the metal ever leaves the furnace.
As the foundry industry evolves, so must our testing methods. The Hot Distortion Test offers a glimpse into the future of mold and core performance. By embracing this technology, foundries can enhance their processes, reduce scrap, and ultimately improve profitability.
Invest in the future. Invest in precision. The Versatile Hot Distortion Tester is your partner in achieving excellence in foundry operations.
Here’s an overview of the effects of active and dead clays:
Active Clay
Definition and Purpose:
Active clay is the portion of clay in a sand mixture that has been activated by water and mixing (mulling). This process effectively bonds sand grains together. It is also referred to as “live clay.”
The Methylene Blue Clay Test specifically measures the amount of this live or active clay. This test quantifies the exchangeable ions present in the active clay by adsorption of methylene blue dye.
Active clay contributes to the green, dry, and hot strength properties of the green sand.
Effects on Green Sand Properties:
Bonding Capacity: Active clay is essential for providing green compression strength, which is the maximum compression stress the mixture can sustain. This strength is used to control the rate of clay addition to the green sand system. It also develops the plasticity of the clay bond, which controls most sand-related defects.
Moisture Requirement: The type and amount of clay are major factors affecting the sand’s moisture requirement. Active clay hydrates and coats sand particles, influencing muller efficiency, working bond, and available bond.
Muller Efficiency, Working Bond, and Available Bond:
– Available bond indicates the total moisture-absorbing material, including live, latent, and dead clay, and other additives.
– Working bond represents the amount of clay that actively produces bond strength in the sand mix. A higher working bond signifies more efficient use of the clay.
– Mulling efficiency, calculated as working bond divided by available bond, indicates how effectively the clay is utilized.
Casting Defects: Proper active clay content helps avoid defects such as broken molds and poor draws (if too low) or difficult shake-out and poor casting dimensions (if too high).
Dead Clay
Definition and Formation:
Dead clay is clay that has been destroyed by heat and can no longer be plasticized with water. This means it loses its bonding power.
It is considered a non-bonding or inert material.
When iron or steel is poured into green sand molds, the intense heat can burn a proportion of the clay, destroying its bonding properties.
Effects on Green Sand System and Casting Quality:
Loss of Bonding Power: As dead clay builds up, the sand loses its ability to bond effectively. This necessitates additions of new clay to restore properties.
Build-up and Contamination: Dead clay, along with coal ash (if coal dust is used), accumulates in the sand as it is reused. This build-up is sometimes referred to as “oolitic material,” which can also include ash.
Reduced Permeability: The accumulation of dead clay and fines significantly reduces the permeability of the sand. This hinders the escape of water vapor and other mold gases, which can lead to defective castings.
Increased Moisture Requirement: A build-up of oolitic material (dead clay/ash) can increase the sand’s moisture-absorbing needs. It indicates that insufficient new sand is entering the system to dilute it.
Casting Defects: A drop in specimen weight, which indicates a build-up of oolitic material, can lead to defects such as burn-in, burn-on, and penetration defects. For instance, burn-on can occur if impurities, especially alkalis, or certain binders (like sodium silicate) reduce the refractoriness of the sand, creating liquid phases at lower temperatures.
Overall Impact on Green Sand System
Continuous Recycling: Green sand is continuously recycled. This requires regular additions of new clay, coal dust (if used), and water to compensate for the loss of active clay due to heat.
Control of Properties: Maintaining the correct balance of active and inert components is crucial for consistent molding properties and casting quality. Regular testing for active clay content (Methylene Blue Clay Test) and total clay content (AFS Clay Content) is essential for monitoring and controlling the green sand system.
System Inertia: Sand systems have inherent inertia. Changes in clay additions take time (about 20 cycles or roughly a week) to fully impact the total clay content and other properties. Quick adjustments to moldability are primarily made by altering water content.
Conclusion
In summary, understanding the roles of active and dead clay in green sand systems is vital for optimizing foundry operations. The balance between these two types of clay significantly affects the quality of castings. Regular testing and adjustments are necessary to maintain the desired properties of the green sand mixture. By focusing on these aspects, I can ensure the production of high-quality castings with minimal defects.
For more information on foundry sand testing equipment, check out Versatile.
Analytical sieving is one of the most widely used particle size analysis techniques in laboratories and industrial quality control. In principle, using the same sieve set on the same material sample should yield identical results. However, practitioners frequently observe small but significant variations in the particle size distribution data when tests are repeated.
These variations are not necessarily due to sieve defects, but rather a combination of sample-related, operator-related, and instrument-related factors. Understanding these sources of error and adopting scientific remedies ensures reliable, reproducible, and compliant results in line with ASTM E11, ISO 3310-1, and ISO 2591-1 standards.
1. Sample-Related Factors
1.1 Non-Homogeneous Samples
Even when taken from the same bulk material, individual test portions may not be perfectly identical. Segregation of fines and coarse particles occurs naturally during handling and transport.
Remedy: Use sample splitters (riffle splitter or rotary sample divider) to ensure representative test portions. Always remix bulk samples before sub-sampling.
1.2 Moisture Content Variations
Moisture causes fine particles to agglomerate, altering their effective particle size. Two aliquots of the same sample may behave differently if one portion has absorbed more atmospheric moisture.
Remedy: Control laboratory temperature and humidity, and pre-dry moisture-sensitive materials before sieving.
1.3 Agglomeration and Cohesion
Powders with electrostatic charges or cohesive forces can form aggregates that pass or block mesh apertures inconsistently.
Remedy: Use dispersing agents, ultrasonic sieving, or controlled tapping to break agglomerates.
2. Operator-Related Factors
2.1 Inconsistent Sieving Time and Technique
Different operators may vary the sieving time, shaking intensity, or tapping technique. Even mechanical shakers, if not standardized, can produce slightly different energy inputs.
Remedy: Follow a standard operating procedure (SOP) defining exact sieving time, shaker amplitude/frequency, and sample mass. Automate sieving where possible.
2.2 Human Error in Weighing and Recording
Errors in weighing the test sample, collecting fractions, or recording results can introduce discrepancies.
Remedy: Calibrate balances regularly and train operators. Use digital data logging to minimize transcription errors.
3. Instrument and Sieve-Related Factors
3.1 Mesh Blockage or Blinding
Particles can wedge into sieve apertures during one run but may dislodge in another, changing the mass retained on a sieve.
Remedy: Clean sieves carefully between tests using soft brushing, ultrasonic cleaning, or air blasting (depending on mesh size).
3.2 Mechanical Wear of Sieves
Even high-quality stainless steel monolithic sieves (ASTM E11 / ISO 3310-1) can undergo gradual aperture enlargement or wire fatigue over time, altering separation efficiency.
Remedy: Perform periodic calibration and inspection of sieves, and replace those outside tolerance.
3.3 Variation in Sieving Energy
Manual shaking, different mechanical shakers, or variations in clamping pressure can change how particles stratify through the mesh stack.
Remedy: Use a standardized sieve shaker with controlled amplitude, frequency, and duration to minimize variability.
3.4 Electrostatic Charge
In fine powders, static charges can cause particles to cling to mesh or frame, reducing passage. This may vary between test runs depending on ambient humidity.
Remedy: Use anti-static devices, ionized air, or controlled humidity environments.
4. Environmental Factors
4.1 Temperature and Humidity
High humidity can cause hygroscopic powders to agglomerate; very dry conditions increase electrostatic charging.
Remedy: Maintain laboratory conditions within 20–25 °C and 45–55% relative humidity, as recommended for precision testing.
4.2 Vibration and External Disturbances
Unwanted vibrations from nearby equipment may alter particle migration during sieving.
Remedy: Isolate the sieve shaker on a stable, vibration-free platform.
5. Remedies in Practice: Ensuring Repeatable Results
To achieve reproducibility when using the same sieve set on the same sample, laboratories should implement:
Standardized Test Procedure: Define mass of test portion, sieving duration, amplitude, and endpoint criteria (e.g., <0.1% weight change after 1 min).
Representative Sampling: Use mechanical splitters to avoid bias from sample segregation.
Controlled Environment: Maintain constant temperature and humidity; minimize electrostatic effects.
Sieve Integrity Assurance: Use Versatile’s stainless steel frame and stainless steel mesh monolithic sieves (ASTM E11 / ISO 3310-1 compliant) for superior dimensional stability and durability. Inspect and recalibrate regularly.
Operator Training: Train staff to follow SOPs rigorously and reduce human variation.
Automation: Where possible, use automated sieve shakers with programmable parameters to eliminate operator variability.
Conclusion
Variability in sieve analysis results, even with the same sieve set and same material, arises from a combination of sample heterogeneity, operator technique, sieve condition, and environmental influences. These variations can be minimized — but not entirely eliminated — by adhering to standardized methods, ensuring representative sampling, maintaining controlled test conditions, and using high-quality sieves.
Versatile’s stainless steel monolithic sieves, compliant with ASTM E11 and ISO 3310-1, provide laboratories with maximum reliability by eliminating weak points found in conventional soldered or glued designs. When combined with strict SOPs and environmental control, they ensure high repeatability and reproducibility, the hallmarks of credible particle size analysis.
1. Causes of Variation and Their Scientific Basis
1.1 Sampling Error
Even from the same bulk sample, test portions differ in particle representation. This introduces sampling error, governed by Gy’s Sampling Theory:
Where A0A_0A0 = original open area.Blocked sieves reduce probability of passage, yielding higher-than-true retention.
Remedy: Ultrasonic cleaning for fine sieves; brushing and rinsing for coarse meshes.
1.5 Electrostatic Effects
Electrostatic adhesion adds an effective “force barrier” against particle passage:
Fadh≥FgF_{adh} geq F_gFadh≥Fg
Where:
FadhF_{adh}Fadh = electrostatic adhesion force,
FgF_gFg = gravitational + vibrational force on the particle.
If adhesion exceeds driving force, fines remain trapped.
Remedy: Use ionized air neutralizers or maintain controlled humidity (45–55%).
1.6 Sieve Wear & Tolerance Drift
With repeated use, mesh apertures enlarge slightly. Aperture size deviation (ΔdDelta dΔd) shifts the cumulative distribution function (CDF) of the particle size curve:
High-Quality Sieves: Use Versatile’s stainless steel monolithic sieves (ASTM E11 / ISO 3310-1 compliant) for dimensional stability, corrosion resistance, and long service life.
3. Conclusion
Variations in sieve analysis arise from statistical sampling error, particle cohesion, operator technique, sieve blockage, electrostatics, and mechanical wear. These factors can be mathematically modeled, showing their effect on reproducibility.
By implementing rigorous sampling protocols, standardized testing procedures, and calibrated equipment, laboratories can reduce variability. The use of Versatile stainless steel monolithic sieves ensures stable aperture geometry, compliance with international standards, and enhanced reproducibility — making them an essential tool for credible, scientific particle size analysis.
Causes of Variation in Sieve Analysis: Scientific Effects and Remedies
Cause
Scientific / Mathematical Effect
Remedy
Sampling Error
Sampling variance from Gy’s theory: σs2=C⋅d3Msigma^2_s = frac{C cdot d^3}{M}σs2=MC⋅d3. Smaller sample mass or larger particle size increases error.
Use rotary/ riffle sample dividers; increase test portion size.
Moisture & Cohesion
Agglomeration increases effective particle size: deff=dp⋅f(ϕ,W)d_{eff} = d_p cdot f(phi, W)deff=dp⋅f(ϕ,W) leading to false coarse fraction.
Pre-dry samples to constant weight; control lab humidity.
Sand casting remains a cornerstone of the metal casting industry, valued for its versatility in producing a wide range of component sizes and complexities for both ferrous and non-ferrous alloys (1). Among sand casting methods, the green sand process is particularly dominant, utilized for a significant volume of castings globally, especially in automotive and high-production environments, owing largely to its cost-effectiveness and suitability for automation (1). The term “green sand” refers to a molding mixture composed primarily of sand aggregates, clay binders (typically bentonite), water, and various additives, whose cohesive strength is developed through mechanical compaction rather than heat or chemical setting (7).
The success of the green sand process hinges critically on the consistent quality of the molding sand. Variations in the sand’s physical and mechanical properties—such as moisture content, compactability, strength, and permeability—directly impact the final casting quality, leading to defects, increased scrap rates, and consequently, reduced foundry profitability (7). Historically, foundries relied on subjective “hand-feel” methods or periodic offline laboratory tests to assess sand quality (14). While laboratory testing provides valuable data, its inherent time delays and sampling limitations render it inadequate for managing the dynamic nature of modern, high-speed molding lines (12). The conditions within the sand system can change significantly between the time a sample is taken and the test results become available, making effective process control based solely on these methods reactive rather than proactive (15).
Driven by demands for improved casting quality, tighter dimensional tolerances, higher productivity, reduced operational costs, and greater resource efficiency, the industry has increasingly shifted towards online (in-process) monitoring and automated control systems (9). These systems utilize real-time sensor data and feedback loops to automatically adjust sand preparation parameters, aiming to maintain critical properties within narrow target ranges.
This report provides a comprehensive analysis of the online testing and automated control of green sand systems. It begins by outlining the fundamental principles of green sand composition and properties. It then contrasts traditional offline testing methods with the principles and advantages of modern online monitoring and control. Subsequent sections delve into the specific sensor technologies employed, the integration of these sensors into automated feedback control loops, and the latest technological advancements, including multi-parameter sensing, Industry 4.0 concepts like the Industrial Internet of Things (IIoT), and the application of Artificial Intelligence (AI) and Machine Learning (ML). Finally, the report analyzes the impact and benefits of these advanced systems, explores implementation challenges, and presents illustrative case studies from foundries that have adopted these technologies.
2. Green Sand Fundamentals for Metal Casting
Understanding the composition and critical properties of green sand is essential before exploring control methodologies. The careful balance of its constituents dictates its behavior during molding and casting.
2.1. Definition and Role
Green sand is defined as a molding mixture primarily composed of sand, clay binder, water, and additives. Its defining characteristic is that its cohesive strength, necessary to form and maintain the mold cavity shape, is developed through the mechanical compaction of this moist mixture (7). The term “green” signifies this uncured, moisture-containing state, distinguishing it from chemically bonded or heat-cured sand systems (6).
The primary functions of green sand in the casting process are multifaceted:
Shape Formation: To accurately replicate the pattern’s geometry, creating the mold cavity that defines the casting shape (18).
Structural Integrity: To possess sufficient strength (green strength) to withstand handling during mold assembly, closing, and the metallostatic pressure exerted by the molten metal during pouring without deformation or collapse (19).
Refractoriness: To resist the high temperatures of molten metal without fusing, melting, or reacting excessively with the metal (20).
Gas Permeability: To allow gases—including steam generated from the moisture, air trapped in the mold, and gases evolved from the molten metal or additives—to escape readily through the sand matrix, preventing gas-related casting defects like blowholes (18).
Collapsibility: To break down sufficiently after the casting has solidified, facilitating easy removal of the casting from the mold (shakeout) (11).
Surface Finish: To provide a sufficiently smooth mold surface to impart the desired surface finish to the final casting (2).
2.2. Composition
The specific formulation of a green sand mixture is tailored to the metal being cast, the casting complexity, and the desired quality level, but generally consists of the following components:
Base Sand: This forms the bulk of the mixture, typically 75-85%.18 Silica (SiO2) sand is the most common due to its availability, low cost, and adequate refractory properties (1). High-purity silica sand (e.g., >98% SiO2) offers higher fusion points (around 1704°C or 3100°F), suitable for high-temperature ferrous alloys (20). Other aggregates like olivine, chromite, zircon, or synthetic ceramic media may be used for specific applications requiring higher refractoriness, lower thermal expansion, or to mitigate specific defects like metal penetration or veining (1). Olivine was traditionally used for manganese steel and non-ferrous castings due to its fine finish potential and lack of free silica dust, though it has lower tensile strength than silica (18).The grain size, shape, and distribution of the sand are critical. Grain size is often characterized by the AFS (American Foundry Society) Grain Fineness Number (GFN), with finer sands (higher GFN) generally producing smoother finishes but potentially lower permeability (20). A typical average grain size might be 220-250 μm (2). Grain shape influences flowability and packing density; rounded grains tend to offer higher permeability than angular grains of the same size (21). A controlled grain size distribution, often spanning 3-4 adjacent sieves, is preferred for uniform packing and predictable properties (11). Proper distribution is also crucial for minimizing sand expansion defects (20).
Binders (Clay): Clay acts as the primary binder, coating the sand grains and providing cohesive strength when activated by water (3). Bentonite clay is almost universally used, typically comprising 8-11% of the mixture (4). Bentonite’s primary mineral is montmorillonite, a layered silicate structure (alumina and silica sheets) capable of adsorbing water molecules between its layers (7). This interlayer water is crucial for developing plasticity and bonding strength (7).Two main types of bentonite are used:
Sodium Bentonite (Western Bentonite): Characterized by high durability, high swelling capacity, and excellent hot strength and thermal stability. It is preferred for high-temperature applications like steel and iron casting to resist defects like erosion, inclusions, and expansion scabs (11).
Calcium Bentonite (Southern Bentonite): Develops green properties more rapidly and offers better flowability (less plastic) than sodium bentonite at equivalent moisture levels, making it advantageous for intricate patterns (20). It has lower hot strength and durability compared to sodium bentonite (20). Blends of sodium and calcium bentonite are sometimes used to achieve a balance of properties (20). The concept of “active clay” refers to the portion of the bentonite that retains its ability to absorb water and provide bonding. Repeated exposure to high temperatures near the mold-metal interface can thermally degrade the clay structure, rendering it unable to rehydrate effectively; this is termed “dead clay” (20). Maintaining a sufficient level of active clay is crucial for consistent sand performance.
Water: Added in relatively small amounts, typically 2-5% by weight (4), water is essential for activating the bentonite binder. It creates hydrostatic bonds between water molecules adsorbed onto the clay platelets, imparting green strength, shear strength, and plasticity to the sand mixture (7). The goal is to have water primarily bound within the bentonite layers, not as “free water” filling the voids between sand grains, which can lead to poor properties and gas defects (7). The amount of water required is closely linked to the amount and type of active clay present, as well as the overall surface area of the sand mixture (including fines) (20).
Additives: Various materials are added to the green sand mixture (often <5-10% total) to modify specific properties or improve casting outcomes:
Carbonaceous Additives: Materials like sea coal (finely ground bituminous coal), ground pitch, gilsonite, fuel oil, or proprietary synthetic additives are commonly used, especially in ferrous foundries (3). They decompose at high temperatures, creating a reducing atmosphere at the mold-metal interface. This generates a thin gas film (lustrous carbon) that helps prevent metal penetration into the sand pores, improves casting surface finish, and aids in mold release (stripping) (2). Typical sea coal content is around 5% (18). Concerns over volatile organic compound (VOC) emissions, particularly BTEX (benzene, toluene, ethylbenzene, xylene), have driven the development of low-emission carbonaceous additives or graphite-based substitutes (2). The “spent” portion of these additives contributes to the inert fines content (23).
Cellulose Additives: Materials like cereals (corn flour), wood flour, or oat hulls burn out during casting, creating voids that increase mold permeability and accommodate sand expansion, helping to prevent expansion-related defects like scabs and buckles (7).
Other Additives: Silica flour, iron oxide, pearlite, molasses, dextrin, starches, and proprietary materials may be added to enhance specific properties like hot strength, flowability, collapsibility, or resistance to certain defects (20). Natural starches, for example, have been shown to increase green strength (22).
The precise interaction between these components, particularly the water and clay, is fundamental to achieving the desired green sand properties. Effective mixing or “mulling” is not merely about achieving homogeneity but is crucial for developing the bond by properly distributing water and forcing it into the clay’s layered structure, thereby activating its binding potential (7). This interaction is highly sensitive to factors like temperature. High and variable return sand temperatures, common in foundries, significantly hinder the ability to control moisture content accurately during mulling (7). Hot sand may cause rapid water evaporation before it can be properly incorporated by the clay, or it may impede the clay’s ability to absorb water effectively (26). This leads to inconsistent water levels and, consequently, instability in nearly all other critical sand properties (7). Therefore, managing return sand temperature, often through dedicated cooling systems (7), is frequently a prerequisite for achieving stable and predictable green sand properties via online control.
2.3. Critical Properties
Numerous properties are used to characterize green sand and control the molding process. The most critical include:
Moisture Content (%): Defined as the percentage of water relative to the total weight of the sand mixture. It is arguably the single most influential variable, directly affecting clay activation and impacting nearly all other green sand properties (7). Maintaining moisture within a tight target range (e.g., often 3.0-3.3% for iron casting 7, or generally 2-5% 4) is essential for consistency.
Compactability (%): Measures the degree to which a standard, loosely filled sample of green sand compacts under a defined force (typically using a 3-ram AFS tester or a pneumatic squeezer) (14). It is expressed as the percentage decrease in the sample’s height. Compactability is highly sensitive to moisture content and serves as a primary indicator of the sand’s “temper” or readiness for molding (14). Typical values range from 35-50% (14). Low compactability can lead to friable mold edges and difficulties in drawing patterns, while high compactability can result in poor surface finish, gas defects, and mold wall movement (14). It is inversely related to the sand’s bulk density (14).
Green Compression Strength (GCS): Represents the maximum compressive stress a standard cylindrical green sand specimen (typically 2 inches diameter x 2 inches height) can withstand before failure (7). It reflects the mold’s ability to resist deformation from handling forces and the pressure of molten metal (19). GCS is strongly influenced by moisture content (typically increasing with moisture up to a “temper point” then decreasing 20), active clay content, and the degree of mulling (7). Low GCS can cause mold failure or erosion, while excessively high GCS might lead to expansion defects or residual stresses in the casting (21).
Permeability: A measure of the ease with which gases can pass through the compacted sand mold (7). It is determined by factors like sand grain size and distribution, grain shape, binder content, degree of compaction, and moisture content (18). Higher permeability generally corresponds to coarser sands, while lower permeability indicates finer sands or tighter packing (21). Insufficient permeability can trap gases, leading to defects like blowholes, misruns, or expansion defects (scabs, buckles), while excessively high permeability can result in a rough casting surface finish or metal penetration (2).
Mold Hardness: Measures the resistance of the compacted mold surface to indentation by a standardized probe. It indicates the degree of ramming or compaction achieved at the mold face and is related to dimensional accuracy and resistance to erosion by molten metal (27).
Other Important Properties:
Green Shear Strength (GSS): Resistance to shear forces, important for mold sections subjected to sliding stresses (7).
Wet Tensile Strength (WTS): Strength of the sand in the condensation zone just behind the hot mold face; important for resisting expansion defects like scabs (11).
Dry Strength: Strength of the sand after moisture has evaporated, relevant for resisting erosion during metal pouring (18).
Flowability: The ability of the sand mixture to flow into intricate pattern details and compact uniformly under pressure (7). Related to clay type and moisture.
Active Clay: Typically measured using the Methylene Blue (MB) titration test, quantifying the amount of clay capable of adsorbing water and contributing to bonding (7). This differs from the AFS Clay test, which measures total fine particles (<20 microns), including dead clay and inert fines (20). Monitoring the difference between AFS clay and MB clay can indicate buildup of inert fines (20).
Loss on Ignition (LOI) / Volatile Matter: Measures the percentage of combustible material in the sand (carbonaceous additives, organic binders, water in clay) (7). Related to the effectiveness of carbonaceous additives in preventing metal penetration (20).
Shatter Index: An older test indicating toughness or resistance to crumbling, derived from dropping a standard sand specimen (7). Related to mouldability.
Mouldability: A general term describing the sand’s ability to be molded easily and produce a sound mold (7). Often assessed via compactability and shatter index.
These properties are highly interrelated. As highlighted earlier, moisture content and its interaction with active clay, influenced significantly by temperature, form the core system governing properties like compactability and green strength (7). Compactability, in turn, serves as a key indicator guiding water additions during mulling (14). Permeability is linked to grain characteristics, compaction, and moisture (21). Understanding these relationships is crucial for effective green sand control.
Table 1: Key Green Sand Properties and Their Significance
Property Name
Definition/Measurement Principle
Typical Range/Units
Significance/Impact on Mold/Casting Quality
Key Influencing Factors
Moisture Content
Percentage of water by weight in the sand mixture. Measured by drying, calcium carbide reaction, or electronic sensors.
2 – 5 %
Activates clay binder; strongly influences compactability, strength, permeability, flowability, mold atmosphere. Too low: poor strength, friability. Too high: gas defects.
Water addition, return sand moisture, sand temperature, active clay content, fines content, mulling efficiency.
Compactability
Percentage decrease in height of a loose sand sample under standard compaction (e.g., 3-ram AFS or pneumatic).
35 – 50 %
Primary indicator of sand “temper” and moldability. Affects mold density, stability, surface finish, susceptibility to defects (gas, expansion, swell).
Maximum compressive stress a standard green sand specimen can withstand before failure. Measured using a compression tester.
Varies (e.g., 11-15 psi or higher)
Indicates mold’s ability to resist handling forces and metallostatic pressure. Low GCS: mold collapse, erosion. High GCS: expansion defects, potential casting stress.
Moisture content, active clay content/type, degree of mulling (activation), sand grain characteristics, compaction density.
Permeability
Measure of the sand’s ability to vent gases. Measured by airflow resistance through a standard rammed specimen.
AFS Permeability No. (varies widely)
Allows escape of steam and gases. Low permeability: gas defects (blowholes). High permeability: rough surface finish, metal penetration, burn-on.
Sand grain size/distribution/shape, binder content, compaction density, moisture content, fines content, presence of gas-evolving additives.
Active Clay (Methylene Blue)
Amount of clay capable of adsorbing water and providing bonding. Measured by MB titration.
% MB Clay (varies)
Indicates the effective bonding capacity of the sand system. Essential for strength development and water retention. Low active clay requires higher additions.
Tensile strength of sand in the high-moisture condensation zone near the hot metal interface.
N/cm2 or psi
Resistance to cracking/spalling in the condensation zone. Important for preventing expansion defects (scabs, buckles).
Bentonite type (Na-Bentonite higher), moisture content, active clay level, additives.
3. Traditional Green Sand Property Assessment
For decades, foundries have relied on a suite of standardized laboratory tests to monitor and control green sand properties. These tests, typically performed offline on samples periodically extracted from the sand system, provide fundamental characterization data.
3.1. Overview of Standard Offline Laboratory Methods
Common laboratory procedures, many standardized by organizations like the AFS, include 8:
Moisture Content: The most frequent test. Quick estimates are often obtained using a pressure vessel where moisture reacts with calcium carbide to generate pressure proportional to the water content (21). More accurate, but slower, methods involve determining the weight loss after drying a sample in an oven at approx. 105°C or using a moisture balance that combines heating (often halogen lamp) and weighing (21). Care must be taken during heating to ensure only water is driven off, not other volatile components (21).
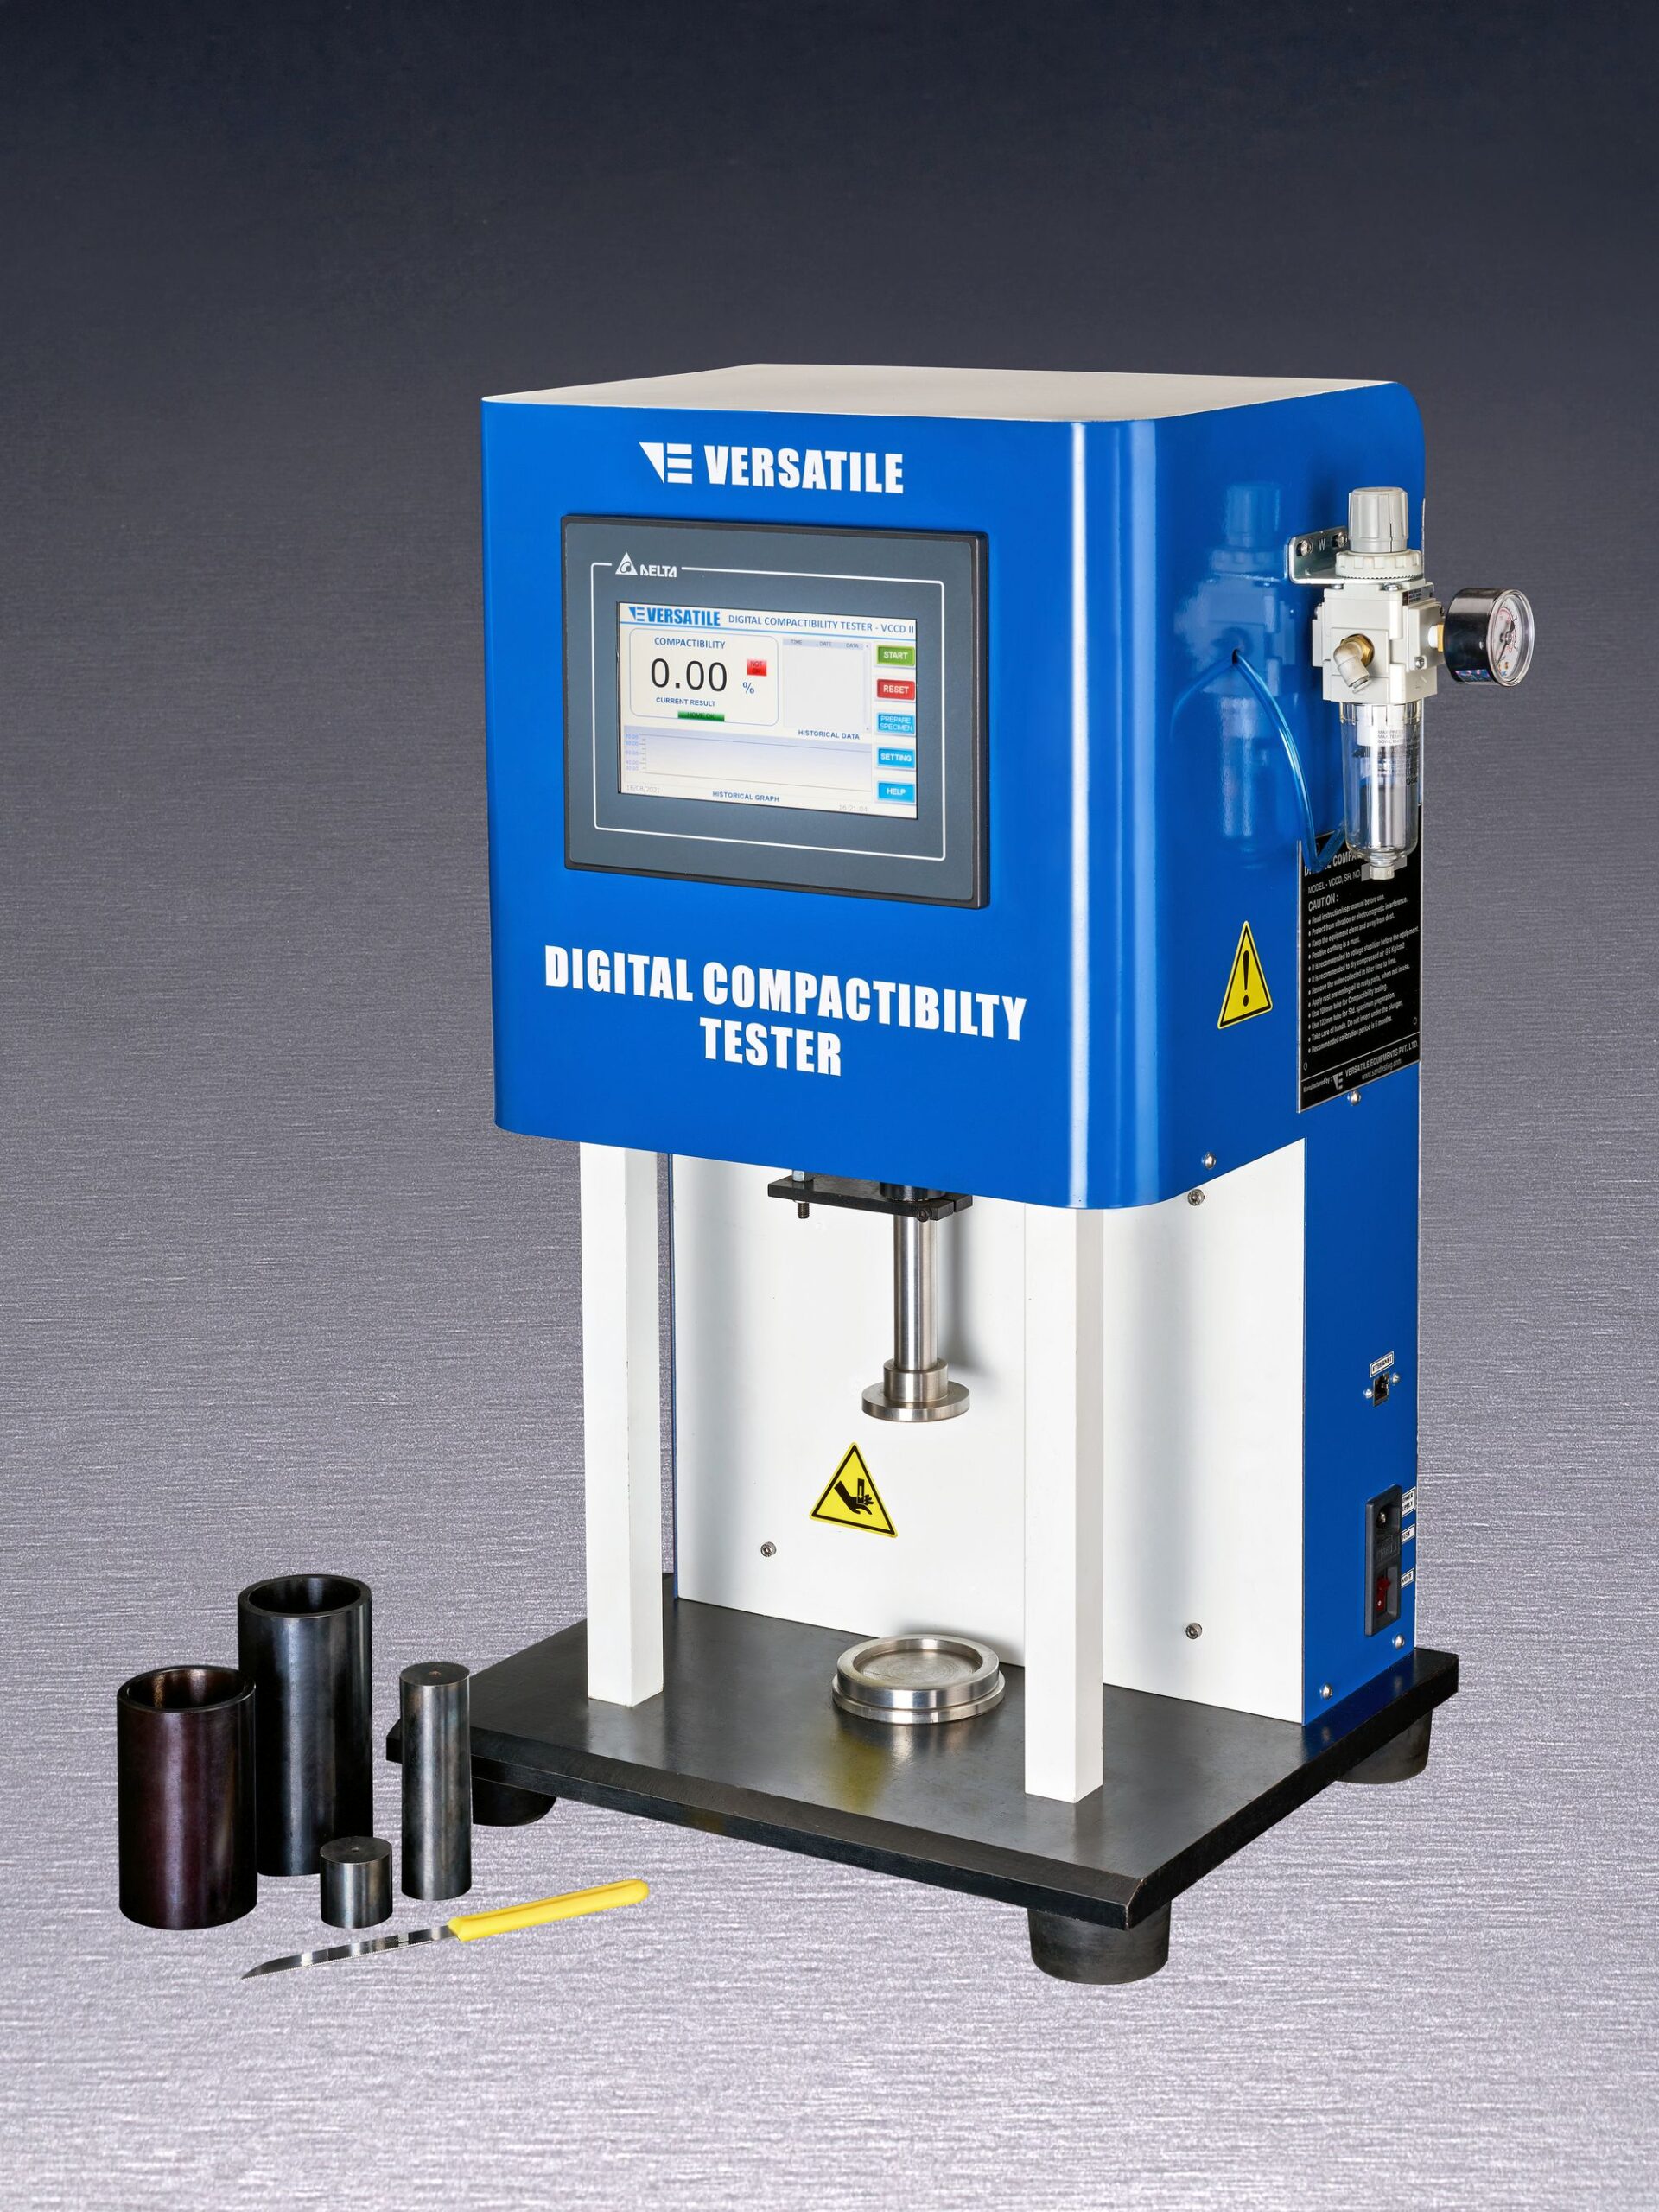
Compactability: A standard AFS 3-ram test involves riddling sand into a specimen tube, striking it level, and dropping a standard weight onto it three times (14). The percentage decrease in the sand column height is the compactability. Pneumatic squeezers apply a controlled air pressure to compact the sample, which is considered by some to better simulate the action of modern molding machines (14). Digital readouts on pneumatic testers can also reduce operator reading errors (14). Proper procedure (careful placement, avoiding pre-compaction, clean tubes) is crucial for accurate results (14).
Green Compression Strength (GCS): A standard 2×2 inch cylindrical specimen, typically formed using the same 3-ram procedure as for compactability, is placed in a universal sand strength machine and loaded in compression until failure (8). The maximum load achieved is reported as GCS.
Permeability: Using the same standard specimen, air is passed through it at a controlled pressure, and the flow rate or back-pressure is measured (8). This value is converted into a standard permeability index number, indicating the sand’s ability to vent gases.
Active Clay (Methylene Blue – MB Test): This chemical titration method determines the cation exchange capacity of the clay, which correlates with its ability to absorb water and act as an active binder (7). It specifically measures the “active” or “live” bentonite. Newer spectrophotometric methods using copper-based dyes have also been developed, potentially offering faster, digital readings (31).
AFS Clay Content: This test measures the total percentage of fine material smaller than 20 microns (or settling slower than 1 inch/min in water) (20). It involves washing a dried sand sample, agitating it with sodium hydroxide solution, allowing coarser particles to settle, and siphoning off the suspended fines (clay, dead clay, silt, carbonaceous material, etc.) (28). The remaining sand is dried and weighed to determine the percentage of fines removed (28). This value is always higher than the MB active clay value (20).
Grain Fineness and Distribution: A dried, clay-free sand sample is shaken through a standard set of nested sieves for a defined time (e.g., 15 minutes) (28). The weight of sand retained on each sieve is measured, and calculations are performed to determine the AFS Grain Fineness Number (GFN), which represents the average grain size, and the distribution across the sieves (8).
Other Tests: Procedures also exist for Green Shear Strength (7), Wet Tensile Strength (8), Dry Strength (18), Shatter Index (7), Loss on Ignition (LOI) (7), and Mold Hardness.
3.2. Inherent Limitations for Dynamic Process Control
While essential for baseline characterization and long-term trend monitoring, these traditional offline methods suffer from significant limitations when applied to the dynamic control of high-production green sand systems:
Time Delay: The entire process of sampling, transporting the sample to the lab, performing the test procedure (which can take several minutes or longer, especially for drying or titration), and reporting the result introduces a considerable delay (15). In a fast-cycling molding line or continuous mixing system, the sand conditions represented by the sample may have substantially changed by the time the result is known (12).
Sampling Representativeness: Obtaining a truly representative sample from a large, circulating sand system (potentially hundreds of tons) is challenging (8). A single grab sample might not accurately reflect the average condition or the range of variation within the system.
Manual Processes and Potential Error: Manual sampling, specimen preparation (e.g., ramming consistency), instrument reading, and data recording are all susceptible to human variability and error (10). Different operators might obtain slightly different results even on the same sample.
Reactive Control: Control decisions based on delayed lab results are inherently reactive (15). Adjustments are made after a deviation has already occurred and potentially affected production. This approach cannot effectively compensate for rapid fluctuations in return sand properties (e.g., moisture spikes, temperature changes) that occur between sampling intervals (12).
Limited Frequency: Due to the time and labor involved, the frequency of laboratory testing is often restricted (e.g., once per hour, once per shift). This low sampling rate cannot capture the high-frequency dynamics of the sand system, especially in automated plants where mixer cycles might be measured in seconds or minutes (9).
The fundamental issue lies in the mismatch between the time scale of traditional laboratory testing (minutes to hours) and the time scale of green sand processing in modern foundries (seconds to minutes) (9). Return sand properties can fluctuate significantly due to variations in casting cooling times, core sand dilution, ambient conditions, and shakeout efficiency. These fluctuations impact the requirements for water and binder additions in subsequent mixer batches. Offline testing is simply too slow to detect and respond to these short-term variations effectively. This temporal disconnect prevents the establishment of tight, stabilizing feedback control loops based solely on traditional lab methods, necessitating the move towards online, real-time monitoring.
4. Online Green Sand Monitoring and Automated Control
To overcome the limitations of offline testing and meet the demands for higher consistency and efficiency, foundries have increasingly adopted online monitoring and automated control systems. These systems aim to measure critical sand properties in real-time or near real-time directly within the process stream and use this information to automatically adjust sand preparation parameters.
4.1. Rationale and Advantages
The implementation of online testing and automated control offers numerous compelling advantages over traditional methods:
Real-Time Data Acquisition: Sensors integrated into the sand preparation line provide continuous or high-frequency measurements (e.g., every batch cycle or even faster), offering immediate visibility into the current state of the sand (9).
Improved Process Consistency: By enabling rapid feedback and automated adjustments, these systems can significantly reduce the variability in key properties like moisture and compactability, leading to more stable sand quality delivered to the molding line (9). Hundreds of foundries have reported reduced compactability swings and stabilized moisture levels (10).
Reduction in Casting Defects: Consistent sand properties directly translate to fewer sand-related casting defects, such as blowholes, pinholes, expansion defects (scabs, buckles), metal penetration, erosion, swells, and poor surface finish (7). This leads to lower scrap rates and improved casting quality (11).
Optimized Resource Consumption: Precise control allows for more accurate dosing of water, bentonite, and other additives based on real-time needs, minimizing overuse and waste, thereby reducing raw material costs (9). Optimized mulling cycles (e.g., mulling to a target energy input rather than fixed time) can also lead to energy savings (9).
Increased Productivity and Throughput: Stable sand quality supports higher molding line speeds and reduces downtime caused by sand-related problems (e.g., mold breaks, sticking) or the need for manual intervention (4). This enhances overall plant efficiency and profitability (9).
Automation and Reduced Labor Dependence: Automated testing and control reduce the need for constant manual sampling, laboratory testing, and operator adjustments, freeing up personnel for other tasks and minimizing human error (10).
Table 2: Comparison of Traditional vs. Online Green Sand Testing Approaches
Feature
Traditional Lab Testing
Online Automated Testing
Measurement Frequency
Low (e.g., hourly, per shift)
High (e.g., per batch, continuous) 9
Time Delay
Significant (minutes to hours) 15
Minimal (seconds to minutes) 12
Data Type
Discrete, historical snapshots
Continuous or near real-time data stream 37
Control Mode
Reactive (adjustments based on past data) 15
Proactive/Predictive & Reactive (feed-forward and feedback control) 10
Labor Intensity
High (manual sampling, testing, data entry) 10
Low (automated sampling, testing, control) 10
Consistency Impact
Limited ability to control short-term variations; higher property variability possible.
Significantly improved consistency; tighter control over property variations 9
4.2. Key Sensor Technologies for Real-Time Measurement
A variety of sensor technologies are employed in online green sand monitoring systems:
Microwave Sensors: These sensors measure the dielectric properties (relative permittivity and loss factor) of the sand mixture. Since water has significantly different dielectric properties compared to sand and clay, these measurements correlate strongly with moisture content (43). Microwave techniques can offer volumetric measurements due to their penetration depth. Methods include cavity perturbation techniques (CPT) operating at specific frequencies (e.g., 2.45 GHz) or transmission line methods (43). Research has also explored low-frequency (e.g., 29-33 MHz) multi-probe detectors, potentially offering optimized configurations for green sand (43). However, microwave measurements can be influenced by other factors like sand temperature, density, texture, and the content of bentonite and coal powder, necessitating careful calibration, potentially using multi-variable models like neural networks to isolate the moisture effect (43). While microwave barriers are used for level detection (13), sensors specifically designed for moisture measurement based on dielectric properties are more relevant here.
Near-Infrared (NIR) Sensors: NIR spectroscopy works on the principle that specific molecules absorb light at characteristic wavelengths in the near-infrared spectrum. Water (O-H bonds) has strong absorption bands in the NIR region (44). Online NIR sensors typically project NIR light onto the moving sand stream (e.g., on a conveyor belt or in a chute) and measure the reflected light intensity at specific water-absorbing wavelengths compared to reference wavelengths (44). The difference is correlated to surface moisture content. This is a non-contact measurement technique. Accuracy depends on proper calibration for the specific sand mixture and application (44). These sensors are available with ruggedized housings (e.g., IP65 rated) suitable for foundry environments and can be integrated with various communication protocols (44). Optical analyzers using NIR have shown good correlation with lab moisture tests in foundry case studies (46).
Automated Compaction Testers: These are integrated units designed to replicate the laboratory compactability test automatically and online. They typically extract a sand sample from the process stream (e.g., mixer discharge belt), automatically prepare a standard specimen, apply a compaction force (often pneumatic, considered more representative of molding machines than the traditional 3-ram method 14), measure the resulting compaction percentage, and discharge the used sample (9). Leading automated testing systems provide this core functionality. Some advanced units can also measure Green Compression Strength (GCS) and Permeability on the same automatically prepared specimen within a short cycle time (e.g., 90 seconds for some models 35), providing multi-parameter data. These testers often form the core sensing element in closed-loop control systems.
Temperature Sensors: Given the significant impact of temperature on moisture retention and overall sand properties (7), temperature measurement is crucial. Simple, robust probes (e.g., PT100 RTDs 17) are typically installed to measure return sand temperature before the cooler/mixer and sometimes the temperature of the sand after mixing or cooling (12). This data is essential input for control algorithms, particularly for calculating initial water additions.
Conductivity/Capacitance Probes: Some systems utilize probes that measure the electrical conductivity or capacitance of the sand mixture, as these properties are also influenced by moisture content (12). These are often used for monitoring return sand moisture.
Load Cells/Weighing Systems: Accurate batching is fundamental to control. Load cells are integrated into mixer weigh hoppers or placed under belt sections (belt weighers) to precisely measure the amount of sand entering the mixer for each batch (10). They are also critical components in automated dosing systems for accurately weighing and dispensing dry additives like bentonite and carbon (9).
While direct moisture sensors like microwave and NIR are available and used, a notable trend in many sophisticated online control systems is the focus on directly measuring and controlling compactability using automated testers (9). Compactability is highly sensitive to moisture but also reflects the combined effects of water content, clay type and activation state, temperature, and fines content (14). Controlling compactability directly provides a more holistic, functional measure of the sand’s readiness for molding—how it will actually behave under compaction forces—rather than relying solely on the percentage of one component (water). This approach may offer more robust control in the face of variations in other sand parameters that can shift the relationship between moisture content and molding performance.
Regardless of the sensor type, accurate and reliable measurement in the harsh and variable foundry environment hinges on proper calibration and maintenance. Sensors measuring properties influenced by multiple factors (like microwave or NIR moisture sensors affected by temperature, density, or composition 43; or compaction testers needing mechanical upkeep 14) require careful initial setup against reference methods, regular verification, and potentially the use of advanced calibration models or adaptive control algorithms to compensate for these interferences and drift over time (12).
Table 3: Overview of Online Sensor Technologies for Green Sand Properties
Sensor Type
Principle of Operation
Primary Measured Property(ies)
Typical Installation Location
Advantages
Limitations/Considerations
Microwave
Measures dielectric properties (permittivity, loss factor) correlated with water content (43).
Moisture Content
In mixer, on conveyor belts, in chutes (43).
Volumetric measurement (penetrates material), potentially fast response.
Under mixer hopper, belt sections, additive feeders (9).
Essential for accurate batching and additive control; high accuracy possible.
Requires proper installation and calibration; mechanical system.
4.3. Feedback Control Loops
Online sensors provide the necessary real-time data, but the core of automated control lies in the feedback loop that translates these measurements into corrective actions.
System Architecture: A typical automated green sand control system operates as follows:
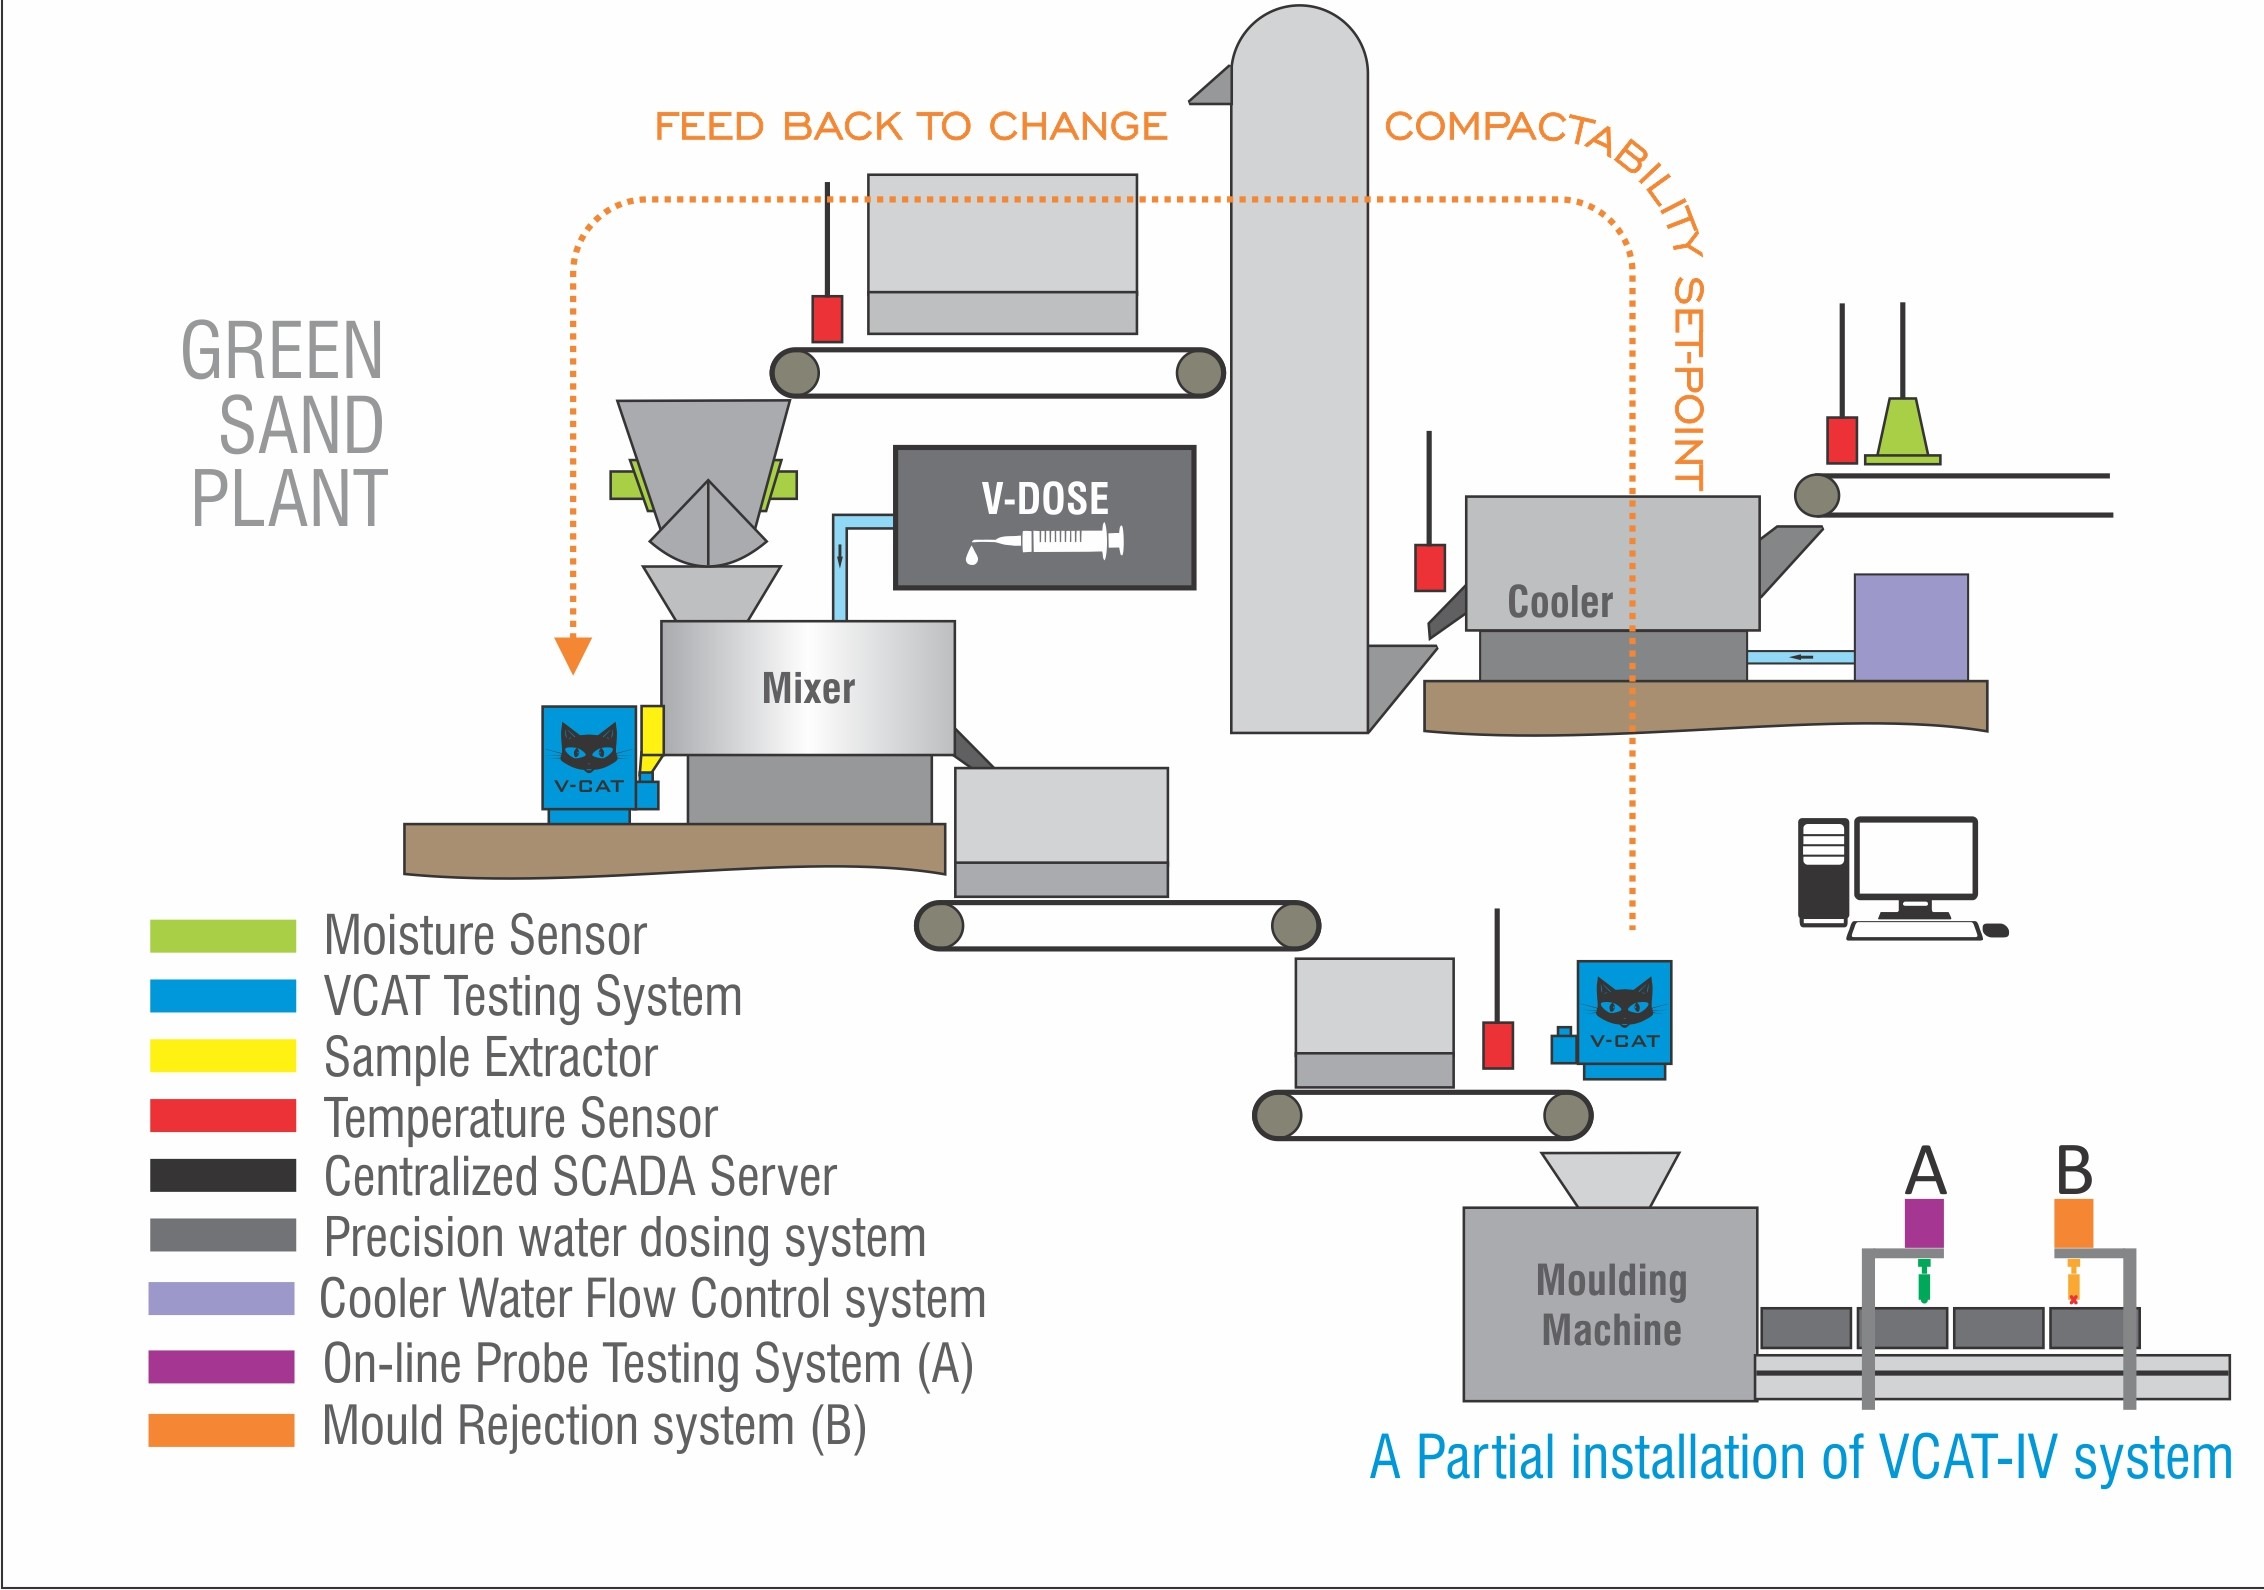
Sensors (e.g., temperature, moisture/conductivity on return sand belt; compactability tester at mixer discharge) measure relevant properties (10).
Sensor signals are transmitted to a central controller, usually a Programmable Logic Controller (PLC) (10).
The PLC executes a control program that compares the measured values against pre-defined target setpoints for the desired sand properties (10).
Based on the deviation between actual and target values, the control algorithm calculates the necessary adjustments to water and/or dry additive additions for the current or subsequent batch (10).
The PLC sends output signals to actuators – typically control valves for water and automated feeders for dry additives (9).
The actuators precisely dispense the calculated amounts of water and additives into the mixer (9).
The cycle repeats, continuously monitoring and adjusting to maintain properties near the target setpoints.
Control Logic and Algorithms: The intelligence of the system resides in the control algorithms embedded within the PLC.
Feed-Forward Control: Many systems utilize measurements of incoming return sand (temperature, moisture/conductivity) to predict the initial (“flush” or primary) water addition required for the batch (10). This anticipates the needs of the incoming sand.
Feedback Control: Measurements taken during or after mixing (e.g., compactability, moisture) provide feedback to correct for prediction errors or unexpected variations. Adjustments are often made via “trim” water additions (12). Proportional-Integral-Derivative (PID) control logic is a common approach for feedback, allowing the system to respond to the magnitude of the error (Proportional), eliminate steady-state offsets (Integral), and anticipate future changes (Derivative) (10).
Bond Control: Algorithms for controlling bentonite additions can vary. Some systems adjust bond based on maintaining a target Green Strength alongside compactability (10). Others might use algorithms that consider the calculated “available bond” based on recent tests or maintain a specific ratio relative to active clay targets (10). Weight-based dosing ensures accuracy (9).
Adaptive/Learning Algorithms: More advanced systems incorporate self-learning or adaptive capabilities. For example, the system might automatically adjust the calibration curve relating sensor readings (like conductivity) to required water additions based on feedback from actual total water used in previous cycles (12). Statistical Process Control (SPC) rules can also be embedded to trigger adjustments when trends deviate beyond control limits (15). Some systems use self-learning for gate positioning based on hopper levels (17).
Actuation: Precise execution of the calculated additions is critical.
Water Addition: Typically uses accurate flow meters (e.g., positive displacement pulse meters) and fast-acting control valves (e.g., diaphragm valves) to deliver the precise volume of water calculated by the PLC (10).
Dry Additive Dosing: Utilizes weight-based systems for accuracy. Load cells measure the weight of additive in a dispensing hopper, which is then fed into the mixer via screw feeders or pneumatic injection systems controlled by the PLC (9).
This combination of feed-forward control based on incoming conditions and feedback control based on mixed sand properties creates a robust multi-stage strategy (10). The feed-forward component provides a good initial estimate, reducing the burden on the feedback loop, while the feedback component corrects for inaccuracies and unexpected disturbances, leading to tighter overall control and faster stabilization compared to feedback-only systems. Various integrated commercial systems incorporating these principles are available from specialized equipment suppliers.
5. Technological Frontiers in Green Sand Management
Building upon established online monitoring and control, several technological advancements are further refining green sand management, pushing towards greater precision, integration, and intelligence.
5.1. Advanced Sensing: Multi-Parameter Sensors and Sensor Fusion
The complexity of green sand, where multiple properties are interdependent, drives the need for more comprehensive sensing capabilities.
Multi-Parameter Probes: Instead of relying on separate sensors for each property, there is a trend towards integrated units capable of measuring multiple parameters simultaneously from a single sample or measurement point. Some automated testers, for instance, measure temperature, moisture, compactability, GCS, and permeability in one automated cycle (35). Similarly, advanced controllers can measure compactability, green strength, and moisture with their integrated tester (10). Research into low-frequency multi-probe dielectric sensors also aims to extract more information (e.g., moisture prediction considering bentonite, coal, and compactability influences) from a single sensor system (43). This approach mirrors developments in other fields, such as multi-parameter water quality sondes measuring numerous chemical and physical parameters (48). The benefit lies in obtaining a richer dataset from a single point in the process with potentially reduced hardware complexity compared to deploying numerous individual sensors.
Sensor Fusion: This concept involves intelligently combining data from multiple, potentially diverse, sensors to achieve a more accurate, reliable, or complete assessment of the system state than possible with any single sensor alone (49). Given the inherent limitations and sensitivities of individual sensors in the foundry environment (e.g., moisture readings affected by temperature and composition 43), fusing data streams offers a promising path forward. For example, an algorithm could combine readings from a microwave moisture sensor, a temperature probe, and a compaction tester, along with knowledge of the sand composition, to generate a more robust estimate of the sand’s effective temper or predict its likely performance in the mold. AI and ML techniques are particularly well-suited for implementing sensor fusion, learning the complex correlations between different sensor inputs and the overall system state (49). While perhaps more established in fields like defense or autonomous systems (49), the principles of sensor fusion are highly relevant to tackling the complexity of green sand control (7). The drive towards combining data from multiple sources can be interpreted as a direct strategy to overcome the challenges posed by the high degree of property interdependence and the sensitivity of individual sensors to environmental or compositional variations. By integrating diverse data points, systems aim to construct a more reliable and comprehensive understanding of the sand’s condition, enabling more accurate and robust control decisions.
5.2. Industry 4.0 Integration: IoT, Cloud Platforms, Data Logging, and Remote Monitoring
The principles of Industry 4.0, centered around connectivity, data, and intelligent automation, are being actively applied in modern foundries, including green sand management systems (37).
Connectivity (IIoT): Sensors, PLCs, mixers, molding machines, and other equipment are increasingly being connected to plant-wide networks and the internet using standard communication protocols (e.g., Ethernet TCP/IP, ProfiNet, Modbus TCP) and specialized Industrial Internet of Things (IIoT) gateway devices (39). This enables seamless data flow between operational technology (OT) on the shop floor and information technology (IT) systems (38).
Centralized Data Logging and Cloud Platforms: The vast amounts of data generated by online sensors and control systems (property measurements, additive amounts, cycle times, equipment status, temperatures, motor currents, etc.) are collected and stored in centralized databases, often hosted on cloud platforms (37). This creates a rich historical record of the process.
Data Visualization and Analytics: Software platforms provide user-friendly dashboards to visualize real-time and historical data trends (37). Standard business intelligence tools (46) or specialized foundry data platforms (39) allow operators, engineers, and managers to monitor Key Performance Indicators (KPIs), track Overall Equipment Effectiveness (OEE), analyze correlations, identify anomalies, and troubleshoot issues more effectively (37).
Remote Monitoring and Expert Support: Connectivity enables remote access to system data and diagnostics. This allows internal experts or even equipment suppliers to monitor performance, provide troubleshooting assistance, and offer proactive maintenance recommendations without needing to be physically present (34). Some suppliers offer remote monitoring centers providing expert oversight and guidance based on real-time data (37).
Integration with Enterprise Systems: Data from the sand plant can be integrated with higher-level plant management systems like Manufacturing Execution Systems (MES) or Enterprise Resource Planning (ERP) for better production planning, inventory management, and overall business intelligence (38).
The implementation of these Industry 4.0/IoT concepts serves a critical purpose beyond simple monitoring. It establishes the essential data infrastructure—reliable data collection, aggregation, storage, and accessibility—that is fundamental for leveraging more advanced AI and ML techniques (39). Without a robust and well-managed flow of high-quality process data, the development and deployment of effective AI-driven optimization models are severely hampered. Thus, IoT deployment is often a necessary prerequisite or concurrent activity for realizing the full potential of AI in optimizing green sand control and broader foundry operations.
AI and ML represent the next frontier in optimizing green sand systems, moving beyond predefined control logic to data-driven prediction, adaptation, and optimization (50).
Predictive Property Modeling: ML algorithms, such as Artificial Neural Networks (ANNs) (43) or Random Forests (59), can be trained on large historical datasets containing sensor inputs (temperature, previous additions, etc.) and corresponding measured sand properties (moisture, compactability, strength) or even casting outcomes. Once trained, these models can predict sand properties in real-time based on current sensor readings (43). This can be particularly valuable for estimating properties that are difficult or slow to measure directly online or for predicting the future state of the sand based on current conditions. General research in materials science is actively exploring ML for property prediction (59).
Control Strategy Optimization: AI can analyze the complex, often non-linear relationships between numerous input variables (return sand properties, additive types and amounts, mixer parameters, ambient conditions) and output variables (final sand properties, casting defect rates). By learning these relationships from historical data, AI systems can recommend optimal setpoints and operating parameters for the existing PLC-based control systems to achieve specific goals, such as minimizing variability, reducing additive consumption, or minimizing specific defect types (39). Techniques like Genetic Algorithms (GA) have also been explored for multi-objective optimization (e.g., balancing strength and cost) (58).
Defect Prediction and Diagnosis: AI techniques, including expert systems, case-based reasoning (CBR) (55), adaptive neuro-fuzzy inference systems (ANFIS) (55), and computer vision combined with ML (57), can be applied to analyze process data alongside casting inspection results. These systems can potentially predict the likelihood of specific defects occurring based on current or recent sand properties and process conditions, allowing for preemptive action. They can also assist in diagnosing the root causes of defects by identifying correlations between process deviations and defect occurrence (27).
Commercial Implementations: Commercial AI solutions are emerging, often developed through collaborations between foundry technology providers and AI specialists (62). These platforms analyze historical production and quality data from the entire foundry process (sand plant, molding, pouring) (40). They learn the optimal process windows for specific castings and prescribe adjustments to control parameters for operators, aiming to significantly reduce scrap rates (39).
An important observation regarding current advanced AI applications is that they often focus on a higher level of optimization rather than replacing the second-to-second feedback control executed by PLCs (10). These AI systems analyze accumulated historical data to identify the optimal operating targets and ranges (prescriptions) for the existing control systems. The PLC continues to handle the real-time adjustments needed to meet these prescribed targets. This suggests AI is currently being implemented primarily as an intelligent advisory layer, leveraging deep process insights gleaned from data to guide the established automation systems towards better overall performance and quality outcomes.
6. Impact, Benefits, and Practical Considerations
The adoption of advanced online testing and automated control systems, particularly when integrated with Industry 4.0 and AI capabilities, offers significant potential benefits for foundries, but also presents practical implementation challenges.
6.1. Quantifiable Benefits
Implementing these technologies can lead to measurable improvements across several key areas:
Improved Casting Quality and Defect Reduction: This is often the primary driver. By maintaining green sand properties within tighter tolerances, the occurrence of sand-related defects is significantly reduced (9). These defects include:
Gas Defects: Blowholes, pinholes caused by excessive moisture or low permeability (14).
Expansion Defects: Scabs, buckles, rattails caused by excessive sand expansion, often linked to high GCS, low WTS, or inadequate volatile materials (11).
Erosion and Sand Inclusions: Caused by low green or dry strength, leading to sand washing into the casting (11).
Metal Penetration: Molten metal penetrating into sand pores, related to coarse sand, low mold density, or insufficient lustrous carbon formers (2).
Swells and Dimensional Inaccuracy: Caused by low mold hardness or excessive compactability leading to mold wall movement (14).
Poor Surface Finish: Linked to coarse sand, high permeability, or inadequate mold face stability (2). Case studies report significant scrap reductions, sometimes exceeding 40-50% for specific parts or foundries after implementing advanced control or AI-driven optimization (13). Improved surface finish reduces subsequent fettling and cleaning costs (5).
Enhanced Process Consistency: Online monitoring and automated feedback loops drastically reduce batch-to-batch and shift-to-shift variability in critical sand properties like moisture, compactability, and strength (9). This leads to a more predictable and stable molding process (9).
Resource Efficiency:
Materials: Precise, automated dosing based on real-time measurements minimizes the overuse of water, bentonite, carbonaceous additives, and other costly materials (9). Reductions in bentonite consumption of 20% or more have been reported (29). Improved system stability may also reduce the required rate of new sand additions needed to counteract dead clay buildup (15).
Energy: Optimizing the mulling cycle, for example by shifting from fixed-time mulling to mulling based on achieving a stable energy input (Mull-to-Energy Stable Power – MTESP), can significantly reduce mulling time (reports of 30-75% reduction) and associated energy consumption without compromising sand properties (9). Better control of sand temperature via efficient cooling systems also contributes to overall energy management (9).
Sand Reclamation: While distinct from control, stable green sand properties can potentially benefit downstream sand reclamation processes (25). Effective reclamation itself offers major cost savings by reducing new sand purchases and disposal costs (66).
Increased Productivity and Profitability: Consistent, high-quality sand enables molding lines to run at higher speeds with fewer interruptions (4). Reduced downtime associated with sand problems or equipment failures (potentially predicted via IIoT monitoring) further boosts throughput (10). Combined with lower scrap rates and reduced resource consumption, these factors contribute directly to lower manufacturing costs and improved profitability (4). Improvements in OEE of 10-15% have been reported with Industry 4.0 implementations (37).
6.2. Implementation Hurdles
Despite the clear benefits, foundries face several practical challenges when implementing advanced online control systems:
Cost: The initial investment can be substantial, encompassing sensors, PLCs, HMIs, automated dosing systems, software licenses, integration services, and potentially necessary upgrades to existing equipment like mixers or coolers (9). While lower-cost options for basic control may exist (41), sophisticated systems involving IIoT and AI represent a significant capital expenditure. Tooling costs associated with process changes can also be considerable (42). A thorough cost-benefit analysis and ROI calculation are essential for justification (38). This calculation is often complex, needing to balance tangible costs (equipment, maintenance) against quantifiable benefits (scrap reduction, material savings) and harder-to-quantify gains (improved consistency, faster response times) (9). The success of implementation frequently hinges on demonstrating a favorable, albeit potentially complex, ROI.
Calibration and Maintenance: Online sensors require accurate initial calibration against reference methods and ongoing verification or recalibration to maintain accuracy in the demanding foundry environment (dust, vibration, temperature fluctuations) (12). Automated testers and dosing systems involve mechanical components that require regular preventative maintenance to ensure reliability (9). Robustness of equipment design is a key factor in minimizing maintenance burden (10).
System Integration Complexity: Integrating new sensors, controllers, and software with existing legacy equipment (mixers, conveyors, molding lines) and the plant’s IT network can be complex (37). It often requires expertise spanning both Operational Technology (OT – the physical process control) and Information Technology (IT – networks, data management) (38). Ensuring compatibility between different vendor systems can also be a challenge.
Data Management and Expertise: IIoT-enabled systems generate large volumes of data. Effectively storing, managing, analyzing, and interpreting this data requires appropriate infrastructure and skilled personnel (data analysts, process engineers familiar with data tools) (37). Foundries may need to invest in training or rely on vendor support services or AI platforms to extract meaningful insights from the data (37). Bridging the potential skills gap in data analytics within the existing workforce is a common challenge (53).
Process Inertia and Change Management: Successfully implementing these technologies requires more than just installing hardware and software. It involves adapting operational workflows, training personnel to use the new tools and trust the data, and fostering a culture that embraces data-driven decision-making (38). Overcoming resistance to change and ensuring management buy-in are crucial for realizing the full benefits (38). Despite the sophistication of automation and AI, human factors remain critical. Proper maintenance, calibration checks, understanding system outputs, effective troubleshooting by technicians, comprehensive operator training, and management commitment to acting on data-driven recommendations are all essential for sustained success (9). Technology deployment is a socio-technical challenge, and neglecting the human and organizational aspects can undermine the potential gains.
6.3. Illustrative Case Studies
Numerous foundries have successfully implemented advanced green sand control systems, demonstrating tangible benefits:
Advanced Online Controllers: Foundries utilizing advanced online controllers consistently report achieving tighter control over compactability and moisture, leading to reduced sand-related defects and more consistent casting quality (10). Implementations have demonstrated improved consistency, reduced bond consumption, improved casting finish, and aided in maintenance diagnostics (15).
IIoT Platforms with AI Optimization: Foundries adopting integrated IIoT platforms combined with AI-driven optimization software have reported significant reductions in scrap rates, sometimes exceeding 50% within months, by following AI-prescribed process adjustments. These systems analyze data from across the production line to identify optimal operating parameters (39). Multi-site foundry groups are leveraging these platforms to monitor KPIs, bridge skills gaps, and drive quality improvements across facilities (53).
Modern Molding Lines and Reclamation: Foundry upgrades incorporating modern automated molding lines integrated with Industry 4.0 technology have driven major operational gains (37). Portable/in-line automated testers offer rapid multi-property testing capabilities and can interface with muller controls (35). Investments in high-capacity thermal reclamation plants with advanced scrubbing and dedusting have shown significant improvements in reclaimed sand characteristics, leading to projected benefits like improved casting surface finish and reduced additive/resin consumption (e.g., 20% bentonite reduction, 20-25% core resin reduction) (29).
Alternative Control Strategies and Sensors: A study involving four iron foundries demonstrated that switching from conventional mull-to-time (MTT) control to a mull-to-energy stable power (MTESP) strategy eliminated over-mulling, reduced average mull times by up to 75% (average 30%), increased muller output, and potentially saved energy, all while maintaining or improving sand property consistency (24). A case study detailed the successful implementation of an optical NIR moisture analyzer over a sand belt in a non-ferrous foundry, achieving excellent correlation (R2=0.99953) with lab tests and providing effective moisture control as an economical alternative (46). Integrated cooling and feedback control systems based on temperature and moisture probes have demonstrated reductions in water additions and mixing cycle times (17).
Process Improvement Methodologies: Six Sigma DMAIC projects have also been successfully applied to green sand processes, identifying root causes of defects and implementing controls to reduce rejection rates (e.g., from 6.94% to 4.69%) and improve process sigma levels (13). Specific defect mitigation (e.g., surface porosity) and process optimization (e.g., feeder application) in green sand have also been subjects of focused case studies (67).
Table 4: Summary of Advanced Green Sand Control System Implementations/Case Studies
Foundry Type/Case Study Focus
Technology Implemented
Key Objectives/Challenges Addressed
Reported Benefits/Outcomes (Quantified where possible)
Reduced water addition (e.g., 40-65L down to 20-30L); reduced total mixing cycle time; potential additive savings (12-16%) reported.
7. Conclusion and Future Directions
The effective control of green sand properties is undeniably critical for the success of metal casting operations, directly influencing casting quality, resource efficiency, and overall foundry productivity. While traditional offline laboratory testing methods provide valuable baseline data, their inherent time delays and limited frequency render them insufficient for managing the dynamic nature of modern, high-volume green sand systems.
The transition towards online, real-time monitoring and automated control represents a significant technological leap forward. By leveraging sensors—measuring key parameters like compactability, moisture, temperature, and strength directly within the process stream—and integrating them into sophisticated PLC-based feedback control loops, foundries can achieve unprecedented levels of consistency in their molding sand. These systems enable proactive adjustments to water and additive additions, compensating for fluctuations in return sand and maintaining properties within tight target ranges. The documented benefits are substantial, including significant reductions in sand-related casting defects and scrap rates, optimized consumption of water and raw materials, enhanced productivity through higher uptime and molding speeds, and reduced reliance on manual intervention.
The current state-of-the-art extends beyond basic automation, embracing Industry 4.0 principles and Artificial Intelligence. IIoT platforms enable seamless connectivity, centralized data logging, and powerful visualization tools, providing comprehensive process visibility. AI and ML techniques are being deployed to analyze this wealth of data, enabling predictive modeling of sand properties, intelligent diagnosis of defect causes, and prescriptive optimization of control strategies, often leading to further dramatic improvements in quality and efficiency, as evidenced by recent case studies.
Looking ahead, several trends are likely to shape the future of green sand management:
Sensor Advancement: Continued development is expected in sensor technology, aiming for more robust, accurate, lower-maintenance, and potentially lower-cost sensors. Multi-parameter sensors capable of measuring several key properties simultaneously will likely become more prevalent.
Sensor Fusion: The application of sensor fusion techniques, likely powered by AI, will grow, combining data from diverse sensor types to create a more reliable and comprehensive understanding of the complex green sand state, overcoming limitations of individual sensors.
AI Sophistication: AI/ML models will become more sophisticated, moving towards fully autonomous optimization loops, adapting control strategies in real-time based on predicted outcomes and learned process dynamics.
Holistic Integration: Digital platforms will increasingly integrate data and control across the entire foundry value chain—from incoming raw material inspection, through sand preparation and molding, to melting, pouring, shakeout, finishing, and final casting inspection—enabling true end-to-end process optimization.
Sustainability Focus: Environmental pressures and resource costs will continue to drive innovation in areas like energy-efficient processing, advanced sand reclamation techniques (25), and the use of environmentally friendly, low-emission additives (5), with control systems playing a key role in optimizing these sustainable practices.
In conclusion, the adoption of advanced online testing, automated control, and data-driven optimization technologies is rapidly becoming not just advantageous, but essential for green sand foundries seeking to thrive in a competitive global market. Mastering these technologies allows foundries to achieve the consistent quality, high efficiency, and optimized resource utilization necessary for sustainable success in the era of Industry 4.0.
Analytical sieves are indispensable in laboratories, industrial quality control, and research applications where precise particle size determination is critical. They are widely employed in fields such as foundry sand testing, mineral processing, pharmaceuticals, food technology, and construction materials analysis. The reliability of particle size distribution data is directly dependent on the dimensional accuracy, structural integrity, and cleanliness of the sieve set.
Among the most advanced designs available are stainless steel frame and stainless steel mesh monolithic sieves, such as those manufactured by Versatile Equipments, which are fully compliant with ASTM E11 and ISO 3310-1. These sieves are fabricated as a single-piece assembly, ensuring mechanical robustness, corrosion resistance, and minimal risk of adhesive or solder failure. Their scientific handling, cleaning, and storage is essential to preserve calibration accuracy and prolong service life.
1. Importance of Proper Maintenance
1.1 Precision and Accuracy
Analytical sieves are calibrated according to standard aperture sizes defined in ASTM E11 and ISO 3310-1. Even slight mesh deformation, particle entrapment, or frame corrosion can introduce systematic errors in size separation, thereby compromising test reproducibility.
1.2 Compliance with Standards
International standards mandate that sieves maintain their dimensional conformity within tolerance limits. Versatile’s monolithic stainless steel sieves are manufactured under stringent quality control, but improper cleaning or storage can degrade compliance over time.
1.3 Durability and Cost Efficiency
Whereas conventional soldered or glued sieves suffer from frame detachment or mesh loosening under aggressive cleaning conditions, monolithic stainless steel construction ensures structural stability and longer lifespan, provided cleaning and storage protocols are rigorously followed.
2. Scientific Cleaning Protocols for Analytical Sieves
The cleaning method depends on the material tested and the aperture size of the mesh. Below are recommended practices:
Rinse immediately after use with deionized or distilled water to prevent crystallization of dissolved salts.
If required, apply a mild laboratory-grade detergent solution.
Gentle manual agitation is acceptable; avoid high-pressure jets that may stretch or distort the mesh aperture.
2.3 Fine Aperture Sieves (<500 μm)
Manual brushing is generally ineffective and may damage the mesh.
Recommended method: ultrasonic cleaning in a water bath with either deionized water or a non-corrosive solvent. Ultrasonics create micro-cavitation that dislodges trapped fines without mechanical stress.
Versatile’s stainless steel monolithic sieves are particularly suited for ultrasonic cleaning, as the absence of solder joints eliminates the risk of cavitation-induced loosening.
2.4 Post-cleaning Drying
Allow sieves to air-dry in a laminar airflow hood or on a clean, lint-free surface.
For rapid drying, a drying oven set to ≤80 °C may be used. Higher temperatures risk altering metallurgical properties or inducing mesh warping.
Avoid wiping the mesh with cloth, which can shed fibers and clog fine apertures.
3. Scientific Storage Protocols
3.1 Orientation and Support
Store sieves vertically in dedicated racks or cabinets to prevent compressive loads that distort mesh geometry.
Avoid stacking sieves horizontally, especially fine aperture meshes, as this leads to frame deformation.
3.2 Environmental Controls
Storage should be in a low-humidity, dust-free environment, ideally maintained at <50% relative humidity.
Stainless steel construction provides superior corrosion resistance; however, chloride-rich environments can still induce localized pitting corrosion if exposure is prolonged.
3.3 Protection Against Contamination
Always use protective lids and collecting pans when sieves are not in use.
Label sieves with mesh size, ASTM/ISO reference, and calibration date for traceability and to prevent misapplication.
3.4 Calibration and Verification
Analytical sieves must undergo periodic inspection under magnification to detect broken wires, aperture deformation, or contamination layers.
Regular verification against standardized glass bead sets or master sieves ensures compliance with ASTM E11 and ISO 3310-1 tolerances.
Damaged or non-compliant sieves should be retired from analytical use and clearly marked to avoid accidental reintroduction.
4. Advantages of Versatile’s Stainless Steel Monolithic Sieves
Monolithic Fabrication: Frame and mesh are integrated into a single stainless steel structure, eliminating weak points associated with solder or adhesives.
ASTM E11 and ISO 3310-1 Compliance: Aperture sizes are certified to international standards, ensuring reliability in globally benchmarked industries.
Enhanced Durability: Superior resistance to ultrasonic cavitation, chemical cleaning agents, and thermal cycling.
Corrosion Resistance: High-grade stainless steel prevents rusting, even under repeated wet sieving conditions.
Dimensional Stability: Maintains aperture accuracy over long-term use, reducing recalibration frequency and overall lifecycle cost.
5. Conclusion
Analytical sieves are precision-engineered metrological instruments, not simple laboratory consumables. Their longevity and accuracy depend on rigorous cleaning, careful drying, and controlled storage conditions. Improper handling not only shortens sieve lifespan but also undermines the scientific validity of test results.
Versatile’s stainless steel frame and stainless steel mesh monolithic sieves, compliant with ASTM E11 and ISO 3310-1, represent the highest standard in analytical sieving technology. With disciplined maintenance, these sieves provide:
Superior reproducibility in particle size analysis
Extended operational life compared to conventional designs
Assured compliance with international laboratory standards
By treating them with the same diligence as other high-value laboratory instruments, laboratories and industries ensure accurate, traceable, and reliable particle size measurements—the cornerstone of quality assurance in materials science and process engineering.
The brand new series of handheld mould and core hardness tester, which connects effortlessly to your smartphone via Bluetooth are a game changer in recording your observations along with testing on field. Imagine completing a hardness test and logging the results directly on your device—it simplifies your workflow and supports informed decision-making. Let’s take a closer look at how these testers can transform your processes.
Understanding the Importance of Hardness Testing
Hardness testing is vital for ensuring the integrity of moulds and cores used in metal casting. The hardness levels of these components significantly affect the performance of the final product. For example, if a mould lacks sufficient hardness, it risks failing during the casting process, which can lead to defects and costly production delays.
Mould Hardness Tester (VMHD)
Mould Strength Tester (VMSD)
To stay competitive, operators require immediate and precise feedback from their testing tools. The introduction of fully connected mould and core hardness testers which pass on real-time defect info to metallurgists and line managers is a game changer, offering real-time insights that empower technicians to collect critical data when they need it most.
Innovative Features of Handheld Testers
Portability and Ease of Use: Designed for convenience, these lightweight testers fit easily into your toolkit. This means you can measure hardness at any location, making it easier to perform tests on-site and boost productivity.
Bluetooth Connectivity: The ability to connect the tester to a smartphone via Bluetooth allows users to record comments immediately after each reading. This functionality means data is not only logged but also enriched with context, leading to more informed analysis.
This combination of features supports clear and efficient communication within teams, enhancing both productivity and accuracy.
Enhancing the Testing Process
Imagine the capabilities at your fingertips with wireless connectivity. By entering comments about each reading directly on your smartphone, you improve efficiency and the quality of your data collection. For instance, if a technician notes specific environmental factors during the test—like temperature or humidity—this information becomes extremely useful for future analyses.
When users consistently gather and organize accurate data, decision-making shifts to a more data-driven approach. Quality managers can confidently present findings, promoting a culture of continuous improvement across the organization.
Real-World Applications
How do these handheld testers fit into your everyday operations?
Quality Control: Routine hardness checks on moulds and cores help maintain standards, ensuring defect-free castings. Quality control teams can perform tests more frequently, which leads to higher quality outputs and fewer reworks.
Process Optimization: Analyzing historical data can uncover trends indicative of production issues—like recurring failures in specific moulds. In fact, manufacturers that track and optimize processes can reduce defects by up to 30%, leading to significant cost savings.
Using these tools transforms data into meaningful insights. Teams can discuss results with a foundation of information, enhancing operational practices and leading to better results.
Transitioning into Industry 4.0
The adoption of handheld testers aligns seamlessly with the transition towards Industry 4.0, characterized by smart manufacturing and real-time data analytics. Embracing such innovations boosts productivity and enables manufacturers to react swiftly to market changes.
Incorporating smart devices like mould and core hardness testers not only provides essential data but helps manufacturers remain agile in the face of evolving market demands. This shift leads to smarter operations, ensuring that companies stay competitive.
The Future of Metal Casting
The introduction of handheld mould and core hardness testers with Bluetooth capabilities signifies a pivotal advancement in metal casting. These devices offer reliable hardness measurements while fostering process improvement and ensuring quality assurance.
With the ability to log data in real time and integrate with mobile functions, technicians and managers can significantly enhance their efficiency. As the metallurgy industry continues to evolve, leveraging these advanced tools will be critical for success.
Investing in a handheld mould hardness tester or core hardness tester positions your operations at the forefront of modern manufacturing. Equip yourself with the technology that keeps you informed and adaptable, ensuring you stay ahead of the competition.
With each test, you’re not just measuring hardness; you are embracing the future of smart manufacturing and leading the charge in revolutionizing metal casting.
Discover how these innovations can refine your processes today and pave the way for a brighter, more efficient future in metal casting!
The Rheological and Granular Mechanics of Green Sand
The Clay-Water System: From Platelet Hydration to Cohesive Bonding
The mechanical behavior of green sand is fundamentally governed by the microscopic interactions within the clay-water binder system. The cohesive strength of the sand mixture originates from the unique structure of bentonite clay, which consists of layered aluminosilicate platelets. When water is introduced during the mulling process, its polar molecules are adsorbed into the inter-packet spaces of these platelets, causing them to swell significantly.1 This hydration process creates viscous, cohesive “clay-water bridges” that coat the silica sand grains and bind them together upon compaction.
The process of mulling is the critical energy input required to activate this bonding mechanism. It applies both compressive and shearing forces to the sand mass, which serves two purposes: it breaks down agglomerates of clay, exposing new platelet surfaces for hydration, and it ensures that the resulting tenacious clay-water “putty” is smeared uniformly onto the sand grains.3 The efficiency of this process determines the quality of the bond. Within this system, water exists in two primary states: “temper water,” which is adsorbed by and structurally integrated into the clay platelets, and “free water,” which acts more as a lubricant between coated grains.4 Only temper water contributes directly to the cohesive strength of the mold; excess free water serves primarily to generate large volumes of steam upon contact with molten metal, a primary cause of gas-related casting defects.6
To quantify the state of the binder, foundry technologists use derived properties such as “Available Bond” and “Working Bond.” Available Bond, calculated from Green Compression Strength (GCS) and moisture content, indicates the total potential bonding capacity of the clay in the system. In contrast, Working Bond, derived from GCS and compactability, reflects the amount of clay that is effectively producing bond strength under the current molding conditions. A large discrepancy between these two values can indicate inefficient mulling or issues with the clay-to-water ratio.8
Influence of Bentonite Type: A Comparative Analysis of Sodium vs. Calcium Bentonites
The choice of bentonite type has a profound impact on the final properties of the green sand mold, as sodium and calcium bentonites exhibit distinctly different behaviors. Sodium (Western) bentonite is characterized by its exceptional thermal stability, which translates to superior hot compressive strength and wet tensile strength. This makes it the preferred binder for high-temperature ferrous alloys like steel and ductile iron, where it is critical to prevent thermal-related defects such as sand erosion, inclusions, and expansion scabs.3 Conversely, calcium (Southern) bentonite is known for its ability to develop green properties rapidly, achieving higher green compression strength at lower moisture levels. It also offers better flowability and lower deformation, making it advantageous for producing molds with intricate details, deep pockets, or for lower-temperature non-ferrous applications.3 The quantitative differences are summarized in Table 1.
Table 1: Comparative Properties of Sodium vs. Calcium Bentonite Systems
Property
100% Sodium Bentonite
100% Calcium Bentonite
50/50 Blend
Green Compression Strength
11.8 psi
14.3 psi
12.6 psi
Green Deformation
1.3%
0.95%
1.1%
Wet Tensile Strength
0.466 N/cm2
0.071 N/cm2
0.346 N/cm2
Hot Compressive Strength (1800∘F)
575 psi
110 psi
320 psi
Thermal Stability
Very Good
Poor
Good
Flowability
Less Good
Good
Moderate
Data synthesized from sources.3 All values are for systems at equivalent compactability.
This data illustrates the fundamental trade-off: calcium bentonite provides superior “as-molded” properties (GCS, flowability), while sodium bentonite provides the necessary thermal durability to withstand the rigors of iron and steel pouring.
The Role of Granulometry: How AFS Grain Fineness Number (GFN) Dictates Baseline Properties
While the binder system creates cohesion, the base sand itself dictates the foundational characteristics of the mold. The American Foundry Society Grain Fineness Number (AFS-GFN) is a weighted average that quantifies the particle size distribution of the sand.12 More critically, the GFN serves as a direct proxy for the total surface area of the sand in the system.3 This relationship is paramount; a higher GFN indicates finer sand, which corresponds to a significantly larger total surface area per unit weight. This increased surface area demands a greater volume of the clay-water binder to achieve the same coating thickness on each grain, and therefore requires higher moisture and clay additions to reach a target compactability.3
The selection of an appropriate GFN involves a critical engineering trade-off:
High GFN (Fine Sand): The smaller interstitial spaces between grains produce a smoother mold surface, resulting in a superior casting surface finish. However, these same small, tortuous pathways lead to inherently low permeability, which elevates the risk of gas-related defects as evolving steam and binder gases cannot easily escape.14
Low GFN (Coarse Sand): The large, well-connected voids between grains provide excellent permeability, allowing gases to vent freely. This advantage comes at the cost of a rougher casting surface finish and an increased susceptibility to metal penetration, where metallostatic pressure forces liquid metal into the voids between sand grains.11
Therefore, the stability of the GFN is a prerequisite for the stability of the entire green sand system. Uncontrolled changes, such as a shift in new sand supply or an accumulation of thermally degraded fines, will alter the system’s surface area. This change will disrupt the established relationship between water additions and compactability, making process control exceptionally difficult. The GFN must be considered the master compositional variable that sets the stage for all subsequent physical property control.
Furthermore, the properties of a sand mix are not static after discharge from the muller. Even in a sealed container with no moisture loss, compactability can decrease over time.1 This occurs because the mulling process may not achieve complete hydration of all clay platelets. Subsequently, during transport and storage, less-tightly-bound “free” water continues to slowly absorb into the interior of the clay platelets. This migration transforms water from a lubricant to a bonding agent, making the sand mixture stiffer and less plastic. This time-dependent behavior underscores the necessity of testing the sand at the point of use—the molding machine—to capture its true state at the moment of compaction.
Paradigms of Measurement: From Standardized Specimens to In-Process State Analysis
The AFS 3-Ram Method: Principles, Procedures, and Interpretive Limitations
The traditional standard for green sand testing is the AFS 3-ram method, a procedure dating back to the 1920s designed to replace subjective “hand-feel” evaluations with a quantifiable metric.17 The procedure involves riddling a loose mass of sand into a standard 2-inch diameter specimen tube, striking off the excess to create a fixed initial volume, and applying a fixed energy input by dropping a 14-pound weight from a height of 2 inches three successive times.7 The resulting percentage decrease in height is defined as the compactability.
Historically, the primary utility of this method within a laboratory workflow has been to create a standardized 2-inch by 2-inch cylindrical specimen for subsequent tests, such as green compression strength and permeability. To achieve this fixed geometry, the operator must vary the initial weight of the sand in the tube until the 3-ram procedure yields a specimen of the precise target height.7 While invaluable for benchmarking material properties, this approach has a fundamental limitation: it answers the question, “How much of this sand is required to create a specimen of standard density?” It does not, however, answer the more practical manufacturing question, “What density will my molding machine achieve with this sand?”
The Online Squeezing Method: Replicating the Moulding Machine for True Process Insight
The online squeezing method represents a paradigm shift in both measurement technique and control philosophy. Instead of impact, this method uses a calibrated pneumatic cylinder to apply a controlled squeeze pressure to a fixed mass of sand within a test chamber.17 This action directly simulates the compaction process of modern high-density and jolt-squeeze molding machines.19
The crucial difference is that the final height of the specimen is allowed to vary, and this variation becomes the primary output of the test. The compactability is calculated using the formula:
C(%)=(HinitialHinitial−Hfinal)×100
This method directly measures how a fixed quantity of sand responds to a fixed energy input, which is precisely what occurs within the flask on a production molding line.7 By deploying these systems online, directly at the point of use, foundries can obtain real-time data that reflects the sand’s actual condition, accounting for any changes like moisture loss or continued clay hydration that may have occurred during transport from the muller.13 Table 2 provides typical target property ranges for a high-density iron molding system controlled with this methodology.
Table 2: Green Sand Property Target Ranges for High-Density Iron Moulding
Parameter
Typical Target Value
Allowable Range
Compactability
40%
± 2%
Moisture
3.2%
± 0.1%
Green Compression Strength
31-36 psi (214−248 kN/m2)
–
Permeability
> 100
–
Active Clay (MB)
> 8%
–
AFS Clay
11-14%
–
Loss on Ignition (LOI)
3.5-7.5%
–
Data synthesized from sources.4
This philosophical divide between the two methods is critical. The traditional lab method is a fixed geometry system where density variation is eliminated to produce a standard test piece. The online squeezing method is a fixed energy system that embraces the resulting density variation as the most important signal. It is not merely a faster, automated version of the lab test; it is a more accurate physical simulation of the manufacturing process itself, providing a direct window into the mold’s future state.
Data Correlation: Bridging Measurements from Laboratory and Online Systems
Despite their philosophical differences, studies conducted by the AFS have demonstrated a strong statistical correlation between results from the 3-ram and pneumatic squeeze methods.17 Typically, for the same sand sample, the pneumatic squeezer will yield a slightly higher compactability reading. This strong correlation allows foundries to transition from legacy lab-based control to modern online systems by establishing new, equivalent target ranges, ensuring that historical process data remains relevant.
Furthermore, utilizing both systems can be a powerful diagnostic tool. By comparing the automatic tester reading at the muller with a manual test performed on sand taken from the molding machine hopper, a foundry can precisely quantify the degree of property change—such as drying or continued hydration—that occurs during transport.13 This data can inform adjustments to muller targets or highlight inefficiencies in the sand transport system.
Bulk Density: The Unifying Master Variable of the Compacted Mould
The Direct Link: How Squeezing Compactability Quantifies Achievable Bulk Density
The primary value of the online squeezing compactability measurement lies in its direct and unambiguous relationship to the final bulk density (ρb) of the compacted sand. For a fixed initial mass of sand (m) placed in a cylindrical test chamber of a fixed radius (r), the bulk density is solely a function of the final compacted height (Hf):
ρb=Vfinalm=πr2Hfm
Since compactability is also a direct function of Hf, it serves as a precise, real-time indicator of the bulk density that the sand will achieve under a standard molding force.17 A higher compactability value corresponds directly to a smaller
Hf and therefore a higher bulk density. This density is the master physical variable that dictates all other critical mechanical and thermal properties of the finished mold.
The Density Effect on Electrical Moisture Measurement: Unmasking a Common Source of Control Error
Automated online moisture sensors typically operate by measuring the electrical conductivity or capacitance of the compacted sand specimen. The electrical current primarily flows through the continuous films of temper water coating the sand grains and clay platelets.5 The efficiency of this conduction is highly dependent on the proximity of the conductive particles.
As compactability increases, the resulting bulk density rises, forcing the sand grains closer together. This densification creates more numerous, shorter, and more intimate conductive pathways. The consequence is that for two sand samples with identical gravimetric water content, the sample compacted to a higher density will exhibit a higher apparent moisture reading. Published foundry research confirms that an increase in bulk density of just 0.1 g/cm3 can cause the electrical moisture reading to increase by 0.1% to 0.2%.
This phenomenon can create a pernicious feedback loop in automated control systems. If a transient event causes compactability to rise, the denser specimen will report a higher apparent moisture. A control system programmed to maintain a fixed moisture setpoint will interpret this as the sand being “too wet” and will reduce the water addition in the subsequent batch. This new batch will then be genuinely drier, leading to low compactability and a risk of friability and erosion defects, causing the system to oscillate out of control. This demonstrates that controlling a sand system based on an electrical moisture reading alone is fundamentally flawed; the primary control target must be compactability.
The Physics of Permeability: An Inverse, Non-Linear Function of Inter-granular Void Volume
Permeability is the property that allows gases generated during pouring—steam from moisture and pyrolysis gases from binders—to escape through the mold. It is a measure of the interconnectedness and volume of the void spaces between sand grains, and its value is governed by Darcy’s Law.7
The effect of bulk density on permeability is direct and severe. As higher compactability leads to higher bulk density, the sand grains are packed more tightly, which drastically reduces the total volume of the voids and constricts the channels that connect them. This relationship is both inverse and highly non-linear. Data from AFS and foundry literature consistently show that while a change in compactability from 35% to 40% may only modestly decrease permeability, a further increase from 45% to 50% can cause a precipitous drop, potentially pushing the sand over a “permeability cliff”.18 For a typical iron system sand, this change can reduce permeability from a safe value of 140 to a critically low 100, creating a high probability of trapped gas defects.
The Mechanics of Green Strength: Exponential Gains Through Inter-particle Contact
The Green Compression Strength (GCS) of a sand mold is the maximum compressive stress it can withstand before fracture. This strength is derived from the cumulative cohesive forces of the millions of clay-water bridges acting at the contact points between adjacent sand grains.7
The influence of bulk density on GCS is profound and exponential. As density increases, the number of grain-to-grain contact points per unit volume increases dramatically. This creates a much more robust, interlocked structure capable of resisting higher loads. Consequently, GCS is strongly and directly correlated with bulk density.27 A sand mixture that appears weak may simply be in a low-density state. For example, the same sand composition could exhibit a GCS of
120 kN/m2 (approx. 17 psi) at 35% compactability, but when compacted to 45% compactability, its strength could rise to 170 kN/m2 (approx. 25 psi) without any change in its constituent recipe. This highlights that strength is not just a function of composition, but of the compacted state, which is best measured by compactability.
A Framework for Defect Prediction and Mitigation
By understanding that compactability is a direct measure of the mold’s final density, and that density governs all other properties, a powerful framework for predicting and preventing casting defects can be established. This framework moves beyond simply reacting to defects and enables proactive control of the mold’s physical state. The most practical application of this knowledge is a diagnostic framework, as detailed in Table 3.
Smooth-walled, spherical or oval cavities, often subsurface, revealed after machining. 29
Low Mold Permeability
High (>48-50%)
High Apparent Moisture, Low Permeability (<100)
Evolved steam and binder gases are trapped by the dense mold structure. Gas pressure exceeds metallostatic pressure, forming bubbles in the liquid metal. 6
Reduce compactability target to increase permeability. Verify muller water additions. Check for excessive fines or combustibles (LOI). 18
Sand Erosion / Inclusions
Irregularly shaped sand grains embedded in the casting surface or interior. 15
Low Mold Strength / High Friability
Low (<35-38%)
Low GCS, High Friability (>11%)
Weak, low-density mold surface cannot resist the erosive force of flowing metal. Sand particles are scoured away and trapped in the casting. 6
Increase compactability target to improve mold density and strength. Verify clay content (Methylene Blue test) and mulling efficiency. 15
Metal Penetration
Rough casting surface with sand grains embedded in a metallic matrix. 32
High Mold Permeability / Low Density
Low (<35-38%)
Low GCS, Low Mold Hardness
Large voids between loosely packed sand grains allow liquid metal to be forced into the mold wall by metallostatic pressure. 18
Increase compactability target to create a denser mold face. Consider using a finer base sand (higher GFN) or mold coating. 32
Swell / Mould Wall Movement
Casting is oversized, dimensionally inaccurate, and may show signs of “false shrinkage.” 18
Low Mold Strength
Low (<35-38%)
Low GCS, Low Mold Hardness
The weak, low-density mold wall cannot resist the metallostatic pressure of the liquid metal head, causing the mold cavity to expand. 6
Increase compactability target significantly to increase mold density and rigidity. Ensure adequate flask support and clamping. 18
Expansion Scab
A thin, metallic layer separated from the casting body by a layer of sand. 18
Low Hot Strength / Poor Thermal Stability
Any (often in range but with poor binder)
Low Wet Tensile Strength
At the mold-metal interface, a layer of sand expands rapidly. If the condensation zone behind it has low strength, this layer can buckle and break away, allowing metal to flow behind it. 3
Ensure adequate Sodium Bentonite content for high WTS. Verify seacoal/carbonaceous additive levels. Avoid excessive compactability. 18
The High-Compactability / High-Density Regime: Predicting and Preventing Gas-Related Defects
When online testers indicate a consistently high compactability (e.g., 42-45%), the resulting mold will be hard, dense, and strong, but critically, it will have low permeability. As molten metal fills the cavity, the intense heat instantly vaporizes the moisture in the sand, creating a massive volume expansion as water turns to steam. Simultaneously, any carbonaceous additives and organic binders pyrolyze, generating additional gases.25 In a low-permeability mold, these gases cannot escape through the sand. The internal gas pressure builds until it exceeds the local metallostatic pressure of the liquid metal, forcing bubbles into the casting. These trapped bubbles manifest as defects such as
blows, pinholes, and gas porosity.6 A case study from a ductile iron foundry demonstrated this link clearly: a process drift that caused a drop in permeability led to a 40% increase in gas-related scrap, which was resolved by restoring permeability through sand system corrections.25
The Low-Compactability / Low-Density Regime: Predicting and Preventing Mould Stability Failures
Conversely, a low compactability reading (e.g., <35-38%) signals a soft, porous, and structurally weak mold. While such a mold may have excellent permeability, its mechanical integrity is insufficient to withstand the forces of pouring. The low density means there are fewer grain-to-grain contact points, resulting in a weak cohesive network.15 This state leads to several distinct failure modes:
Erosion and Sand Inclusions: The kinetic energy of the flowing metal stream physically scours away loose sand from the mold walls and runners. This dislodged sand is then carried into the casting cavity, becoming trapped as inclusions.6
Metal Penetration: The large, interconnected voids of the low-density structure provide an easy path for liquid metal to be forced into the mold wall under metallostatic pressure, resulting in a rough, sand-encrusted surface that is costly to clean.32
Swells and Mould Wall Movement: The low green strength is incapable of resisting the static pressure exerted by the liquid metal. The mold cavity walls deform and expand, producing castings that are dimensionally inaccurate and overweight.6
In this low-density regime, the high permeability reading is a misleading and irrelevant parameter. The mold fails mechanically from erosive forces long before gas pressure becomes the primary concern. This illustrates a critical hierarchy of properties: sufficient green strength is a prerequisite for a sound casting. Only after mechanical stability is achieved does permeability become the next limiting factor.
Interpreting the Process Window: A Quantitative Analysis of Four Sand Batches
The following analysis of four distinct sand batches illustrates how to use compactability as the primary interpretive key to predict casting outcomes. The target process window is represented by Batch A.
Batch
Compactability (%)
Bulk Density (g/cm³)
Moisture (Online Reading)
Permeability
Strength (GCS, kN/m²)
Analysis and Predicted Casting Outcome
A
40
1.58
3.3%
145
150
Target Process Window. Properties are well-balanced. The GCS is sufficient to ensure dimensional stability and resist erosion, while the permeability is adequate to evacuate evolving gases. EXPECT GOOD CASTINGS.
B
50
1.68
3.5%
105
190
DANGER: Over-Compacted. The high strength is deceptive. The critically low permeability (105) creates a high probability of trapped steam and core gases, leading to pinholes and blows, especially in complex or poorly vented sections.
C
34
1.49
3.1%
180
115
DANGER: Under-Compacted. The mould is structurally unsound. The low GCS (115) will not resist metallostatic pressure, leading to metal penetration, sand erosion, inclusions, and casting swell. The high permeability is irrelevant due to mechanical failure.
D
45
1.61
3.4%
130
165
Process Drift – Caution. This batch is denser and stronger than the target. While likely acceptable for simple castings, it is trending towards the gas-defect risk zone of Batch B. This could be an early warning of changes in fines or active clay content.
Batch D highlights a more subtle use of compactability data. If operators notice a consistent trend where more water is required over time to maintain the target compactability of 42%, it serves as a powerful leading indicator. This implies that the sand’s total surface area is increasing, likely due to an accumulation of fines or dead clay. This allows engineers to investigate and correct the root cause (e.g., adjust dust collection, increase new sand additions) before the compositional drift becomes severe enough to cause defects.
Advanced Topics in Green Sand Control and Characterization
The Influence of Carbonaceous Additives on Thermal Stability and Gas Evolution
Beyond the primary sand-clay-water system, additives play a crucial role. Seacoal (pulverized bituminous coal) and other carbonaceous materials are added to iron foundry sands to improve casting surface finish. When exposed to the heat of the molten metal, these additives volatilize, creating a gaseous cushion of reducing gases at the mold-metal interface. This phenomenon, known as the formation of “lustrous carbon,” prevents the liquid metal from wetting the silica grains, thereby preventing sand-metal reactions and producing a smooth, clean casting surface.35
However, this benefit comes with a significant consequence: these additives are a major source of gas. Research has shown that increasing seacoal content from 1% to 2% can increase the total evolved gas volume by more than 15%.33 This additional gas volume must be safely vented through the mold’s permeable structure. This creates a systemic balance: a foundry cannot increase seacoal to improve finish without considering the impact on gas load. To compensate, the compactability target may need to be lowered to intentionally increase permeability, providing a larger escape route for the additional gas. This demonstrates that no variable in a green sand system can be adjusted in isolation.
Dynamic Mechanical Properties: Friability, Wet Tensile Strength, and Thermal Erosion
While GCS is a primary measure of strength, other dynamic properties provide a more nuanced understanding of mold performance during the harsh conditions of casting.
Friability: This test measures the surface brittleness of the compacted sand, indicating its resistance to abrasion on mold edges and corners. Friability is inversely and sensitively related to compactability; a small decrease in compactability (drying) can cause a sharp increase in friability, elevating the risk of sand inclusion defects.10
Wet Tensile Strength (WTS): During pouring, moisture from the green sand is driven away from the hot interface, forming a zone of condensation just behind the dry sand layer. WTS measures the tensile strength of this critical zone. High WTS, a key characteristic of sodium bentonite, is essential for preventing expansion defects like scabs and buckles.3
Thermal Erosion: This advanced test measures the bulk surface abrasion resistance of a sand specimen at elevated temperatures, providing a more realistic simulation of the erosive action of flowing metal than room-temperature tests like friability.10
The Future of Sand Control: Insights from Computational Modeling (DEM/FEM)
The future of green sand process optimization lies in computational modeling, which allows for virtual testing and refinement of molding processes. Two primary methods are employed:
Discrete Element Method (DEM): This approach models the green sand as a collection of millions of individual, interacting particles. DEM is exceptionally well-suited for simulating the granular flow of sand during the filling of a mold cavity, predicting initial density variations, and understanding how sand behaves during a “sand shot” in high-speed molding processes.20
Finite Element Method (FEM): This method treats the bulk sand as a continuous medium with defined mechanical properties. FEM is used to simulate the compaction or squeezing phase of molding, predicting the final distribution of density, stress, and mold hardness throughout the mold based on the pattern geometry and applied pressure.40
Together, these simulation tools enable foundry engineers to optimize pattern layouts, gating designs, and molding machine parameters to achieve uniform compaction and minimize the risk of density-related defects before a single physical mold is ever produced.
Conclusion
The transition from traditional, laboratory-based sand testing to online, in-process measurement by the squeezing method represents a fundamental evolution in green sand control. This shift is rooted in a change of philosophy: from creating a standardized specimen of fixed geometry to accurately simulating the fixed-energy compaction of the molding machine itself. The variability in final specimen density, once treated as experimental noise, is now correctly identified as the critical signal.
This analysis has established that compactability, as measured by the online squeezing method, is the most direct and practical indicator of the final bulk density of the sand in the mold. This bulk density is the master physical variable that unifies and dictates all other critical mold properties. The apparent moisture reading, the permeability to gas, and the green compression strength are not independent variables to be chased individually; they are secondary effects of the density achieved during compaction.
By embracing compactability as the anchor for interpretation, foundries can avoid the pitfalls of naive control strategies, such as chasing an apparent moisture setpoint, and begin to control the actual physical state of the mold. This holistic approach provides a powerful framework for proactively predicting casting outcomes. High compactability warns of an impending risk of gas defects due to low permeability, while low compactability signals the danger of mold stability failures like erosion, penetration, and swells. By maintaining compactability within a well-defined process window, foundries can stabilize their sand systems, align process control with metallurgical reality, and achieve a significant reduction in costly casting defects.
Testing the compactability of green sand can be a serious business, but who says we can’t have a little fun while we’re at it? Here’s a lighthearted take on the process of testing green sand compactability
A Funny Manual on Evaluating Compactability of Green Sand
Step 1: Gather Your Sand (and Your Sense of Humor)
First things first, you’ll need a heap of green sand somewhere in a silo or on ground. (psst! : Don’t try to put your hand in a rotating mixer) Not just any sand, but the kind that dreams are made of—well, dreams of metal casting, that is! Grab about around 300 grams of this magical sand (or as much as you can carry without looking like you’re auditioning for a sandcastle competition).
Step 2: The Great Sand Sampling Adventure
Now, you need to collect a representative sample. Picture yourself as a sand archaeologist, plunging a sand sampler (A long slotted pipe that looks like a rocket and has a drill for a nose) into the heap like you’re on a quest for buried treasure. Make sure to twist it around to fill it up—just like trying to get the last slice of pizza at a party!
Step 3: Weighing and Splitting (Not Your Sanity)
Once you’ve got your sample, it’s time to weigh it. Use a sand splitter to divide it into two equal parts. This is like splitting a dessert with a friend—only, in this case, you want both halves to be exactly the same. No arguments over who gets the bigger piece!
Step 4: Fill the Compactability Tube (and Try Not to Spill)
Take your 300 grams of sand and fill it into a compactability tube. Use a tube filler accessory (The one with funnel on its head)—because who wants to do this manually? Strike off the excess sand like you’re giving it a little haircut. Remember, precision is key! You want it neat, not like a toddler’s art project.
Step 5: Ramming It Home
Now comes the fun part: ramming! Place the tube under a sand rammer and give it three solid strokes (Slow and Firm strokes!). Think of it as a mini workout—just don’t start counting your reps out loud or you might scare the other lab workers.
Step 6: The Moment of Truth
Remove the tube and grab your compactability scale. Place it in the tube and see where the sand sits. This is the moment you’ve been waiting for! Level the tube with your eyes (or your best guess) and note the reading. If it’s not what you expected, don’t worry; it’s just the sand’s way of saying, “I’m not ready for the big leagues yet!”
Step 7: Celebrate (or Commiserate)
Once you have your results, it’s time to celebrate your success or commiserate over the sand’s lack of compactability. Either way, you’ve just completed a crucial step in ensuring your green sand is ready to mold!
Conclusion
And there you have it! Testing the compactability of green sand doesn’t have to be a dry affair. With a little humor and creativity, you can make sure your sand is up to snuff while enjoying the process. Now, go forth and conquer those casting challenges with your perfectly compacted green sand!
Black Box is a fully autonomous laboratory in a box for foundry sands, designed to deliver repeatable, operator-independent sand testing and digital traceability. It automates sample handling, sample preparation and selected sand tests to help foundries control sand quality, reduce variation between shifts, and respond faster to non-conformances.
Product Description
Black Box integrates an autonomous robotic system, sample preparation and weighing subsystems, configured test modules, and an iPad-based HMI into a single enclosed unit suitable for near-line or laboratory use. It provides guided operation, automated routines, self-cleaning functions, calibration support, fault recovery, and structured reporting so customers can obtain consistent sand quality data with minimal manual intervention.
Core Features:
1. Autonomous robotic system: automated handling of samples, prepared specimens, and routine actions
2. iPad-based HMI: guided workflows, live status, alarms, and user access control
4. Sample weighing and verification: logged weights linked to sample and batch identity
5. Configurable test suite: supports customer-selected foundry sand tests and reporting templates
6. Self-cleaning systems and routines: routine cleaning cycles to reduce cross-contamination and downtime
7. Sampling apparatus cleaning: cleaning prompts and logged cleaning cycles for sampling interfaces
8. Self calibration support: calibration status indication, reminders, and calibration logging
9. Fault recovery: safe-stop states, alarm guidance, and resume capability after recovery actions
10. Non-conformance alerts: configurable alerts for out-of-spec results and abnormal events
11. Digital traceability: time-stamped records for batch, sample ID, recipe, results, and alarms
12. Data export and connectivity: exportable reports and optional integration to plant QA/QMS systems
General Usage
Define the required test suite and recipe on the iPad HMI, associate the run with a batch/sample identity, and start the run. Black Box performs the configured preparation and testing sequence, presents results on the HMI, logs the run with full traceability, and supports report export and alerts as configured.
Technical Specifications
· Form factor: Enclosed autonomous laboratory unit suitable for on-line/ near-line or laboratory placement
· HMI: iPad/tablet -based interface with guided workflows, alarms, and event history
· Automation: Robotic sample handling with automated preparation, weighing, and test execution (as configured)
· Self-cleaning: Automated cleaning routines for preparation, handling and sampling interfaces
· Calibration: Calibration support functions with status indication and calibration logs
· Commissioning checklist and acceptance records (electronic)
Recommended Pre-requisite Equipment
· Stable placement location (floor) with adequate clearance for service access
· Electrical supply and earthing as per installation requirements
· Compressed air supply if applicable (as per ordered configuration)
· Network connectivity for report export and backups (recommended)
· Waste sand collection and disposal arrangement
· Site PPE and housekeeping tools per foundry policy (brush/vacuum as permitted)
Usage Instructions
Refer instruction manual
Consumables
· Approved cleaning materials for routine cleaning cycles (as specified)
· Replaceable wear parts exposed to sand abrasion (as applicable)
· Sample containers/liners and waste collection consumables (as configured)
· Calibration check accessories used for routine verification (as applicable)
Hazards
· Moving robotic mechanisms and pinch points within the automation zone
· Electrical hazards during servicing and maintenance activities
· Compressed air hazards if applicable
· Dust exposure from sand handling; follow site dust-control and PPE practices
· Manual handling hazards when loading consumables or removing waste containers
Precautions
1. Operate only with trained and authorized users; follow site safety policies and PPE requirements.
2. Keep access doors/panels closed during automatic operation; do not bypass interlocks or alarms.
3. Maintain housekeeping: keep the work area clean, and dispose of waste sand and used consumables routinely.
4. Use only approved consumables and cleaning materials to protect subsystems and measurement integrity.
5. Ensure calibration status is valid before critical testing and follow calibration prompts and records.
6. Follow lockout/tagout procedures for service activities as per site requirements.
Additional Past info:
Autonomous Laboratory for Foundry Sand
The BlackBox is a modular, “lab-in-a-box” solution designed for modern foundries. By automating the sampling and testing process, it removes human error and provides 24/7 digital oversight of your sand system.
1. Smart Connectivity & App Support
The system is built for a mobile-first world, allowing managers and operators to monitor laboratory status from anywhere on the plant floor.
iOS & Android Support: Native mobile apps for real-time alerts, live run-tracking, and remote data review.
Bluetooth Connectivity: Seamless, secure wireless pairing with nearby sensors and mobile devices for localized diagnostics.
iPad/Tablet-Based HMI: High-resolution primary interface for on-site batch selection and workflow management.
Cloud Sync: Optional automatic backup of test results to secure cloud storage for cross-plant benchmarking.
2. Technical Specifications
Category
Requirement
Power Supply
Configurable (Global Standards)
Compressed Air
5 Bar Dry (Dew Point < -40°C)
Data Ports
Ethernet (RJ45), Wi-Fi, Bluetooth 5.0
HMI
Apple iPad Pro (Industrial Grade Case)
OS Compatibility
iOS 15+, Android 12+, Windows 11 (Export)
3. Core Capabilities
Total Autonomy: Robotic handling of sample containers and specimens.
Precision Preparation: Standardized “recipes” ensure every sand sample is conditioned identically.
Integrated Weighing: Automatic weight verification for 100% audit-trail accuracy.
Self-Cleaning: Automated internal routines to prevent cross-contamination between batches.
Smart Recovery: AI-driven fault recovery allows the system to clear minor jams and resume without intervention.
4. Operational Workflow
Select: Choose your test suite via the iPad or Mobile App.
Load: Enable the sampling input (In-line or Manual).
Start: One-touch execution from your handheld device.
Monitor: View live progress bars and robotic state on your phone.
Analyze: Instant digital reports sent via Bluetooth or Network.
5. Scope of Supply
Main Unit: Robotic laboratory enclosure.
Control Hub: iPad HMI with pre-configured software.
Module Suite: Preparation, weighing, and testing modules. (As ordered)
Documentation: Digital manuals (accessible via QR code on the unit).
Tool Kit: Basic servicing tools and initial consumable pack.
6. Safety & Support
Hazards: Moving machinery, pinch points, and dust management (all handled via safety interlocks).
Maintenance: Automated prompts for consumable replacement and calibration.
Support: Remote diagnostics package and on-site commissioning available.
Ready to automate your foundry?
The tests offered to be done with the Black Box include but are not limited to,
Sieve analysis + Sieve cleaning
Strength tests: Compression as well as time-domain compression for no-bake
Active Clay test (along with analysis and conclusions)
Permeability
Moisture (By dry and weight method)
Gas evolution
Loss on ignition
Wet tensile strength
Hot distortion test
Compactability test
Acid demand value (ADV) + pH testing
Tensile Strength test
And the list goes on and on…
End users can choose which tests are important to them and at what time interval are the tests to be conducted. With right sampling attachments, samples for testing can either be taken automatically or can be manually fed to the system.
Black Box also undertakes as per requirements,
· Automatic sampling from process (Wherever possible and necessary)
· Sample splitting in to representative sample
· Weighted sample preparation
· Specimen preparation
Equipment can also include self-cleaning mechanisms for